
Key Takeaways
Managing multiple servers without losing control comes down to one thing: stop relying on memory and start using a system. Manual setups break down faster than most developers expect - usually around server five or six. The system that holds up from one server to twenty-five combines a named server directory, integrated file management, always-visible monitoring, and standardized deployments.
- One named directory for all servers: no raw IPs, no tab guessing
- Integrated file management alongside your terminal: no SFTP app switching
- Live monitoring visible at a glance: not something you SSH into per server
- Standardized deployments: same steps, same outcome, whoever runs them
| Your situation | Best approach |
|---|---|
| 1 - 3 personal servers | Native OpenSSH + ~/.ssh/config |
| Mobile SSH access needed | Termius |
| Free, local, open source | Tabby + Netdata + FileZilla |
| 3 - 25 servers, solo dev or small team | CtrlOps (unified app) |
| 30+ servers, dedicated ops staff | Ansible + Datadog + CI/CD pipeline |
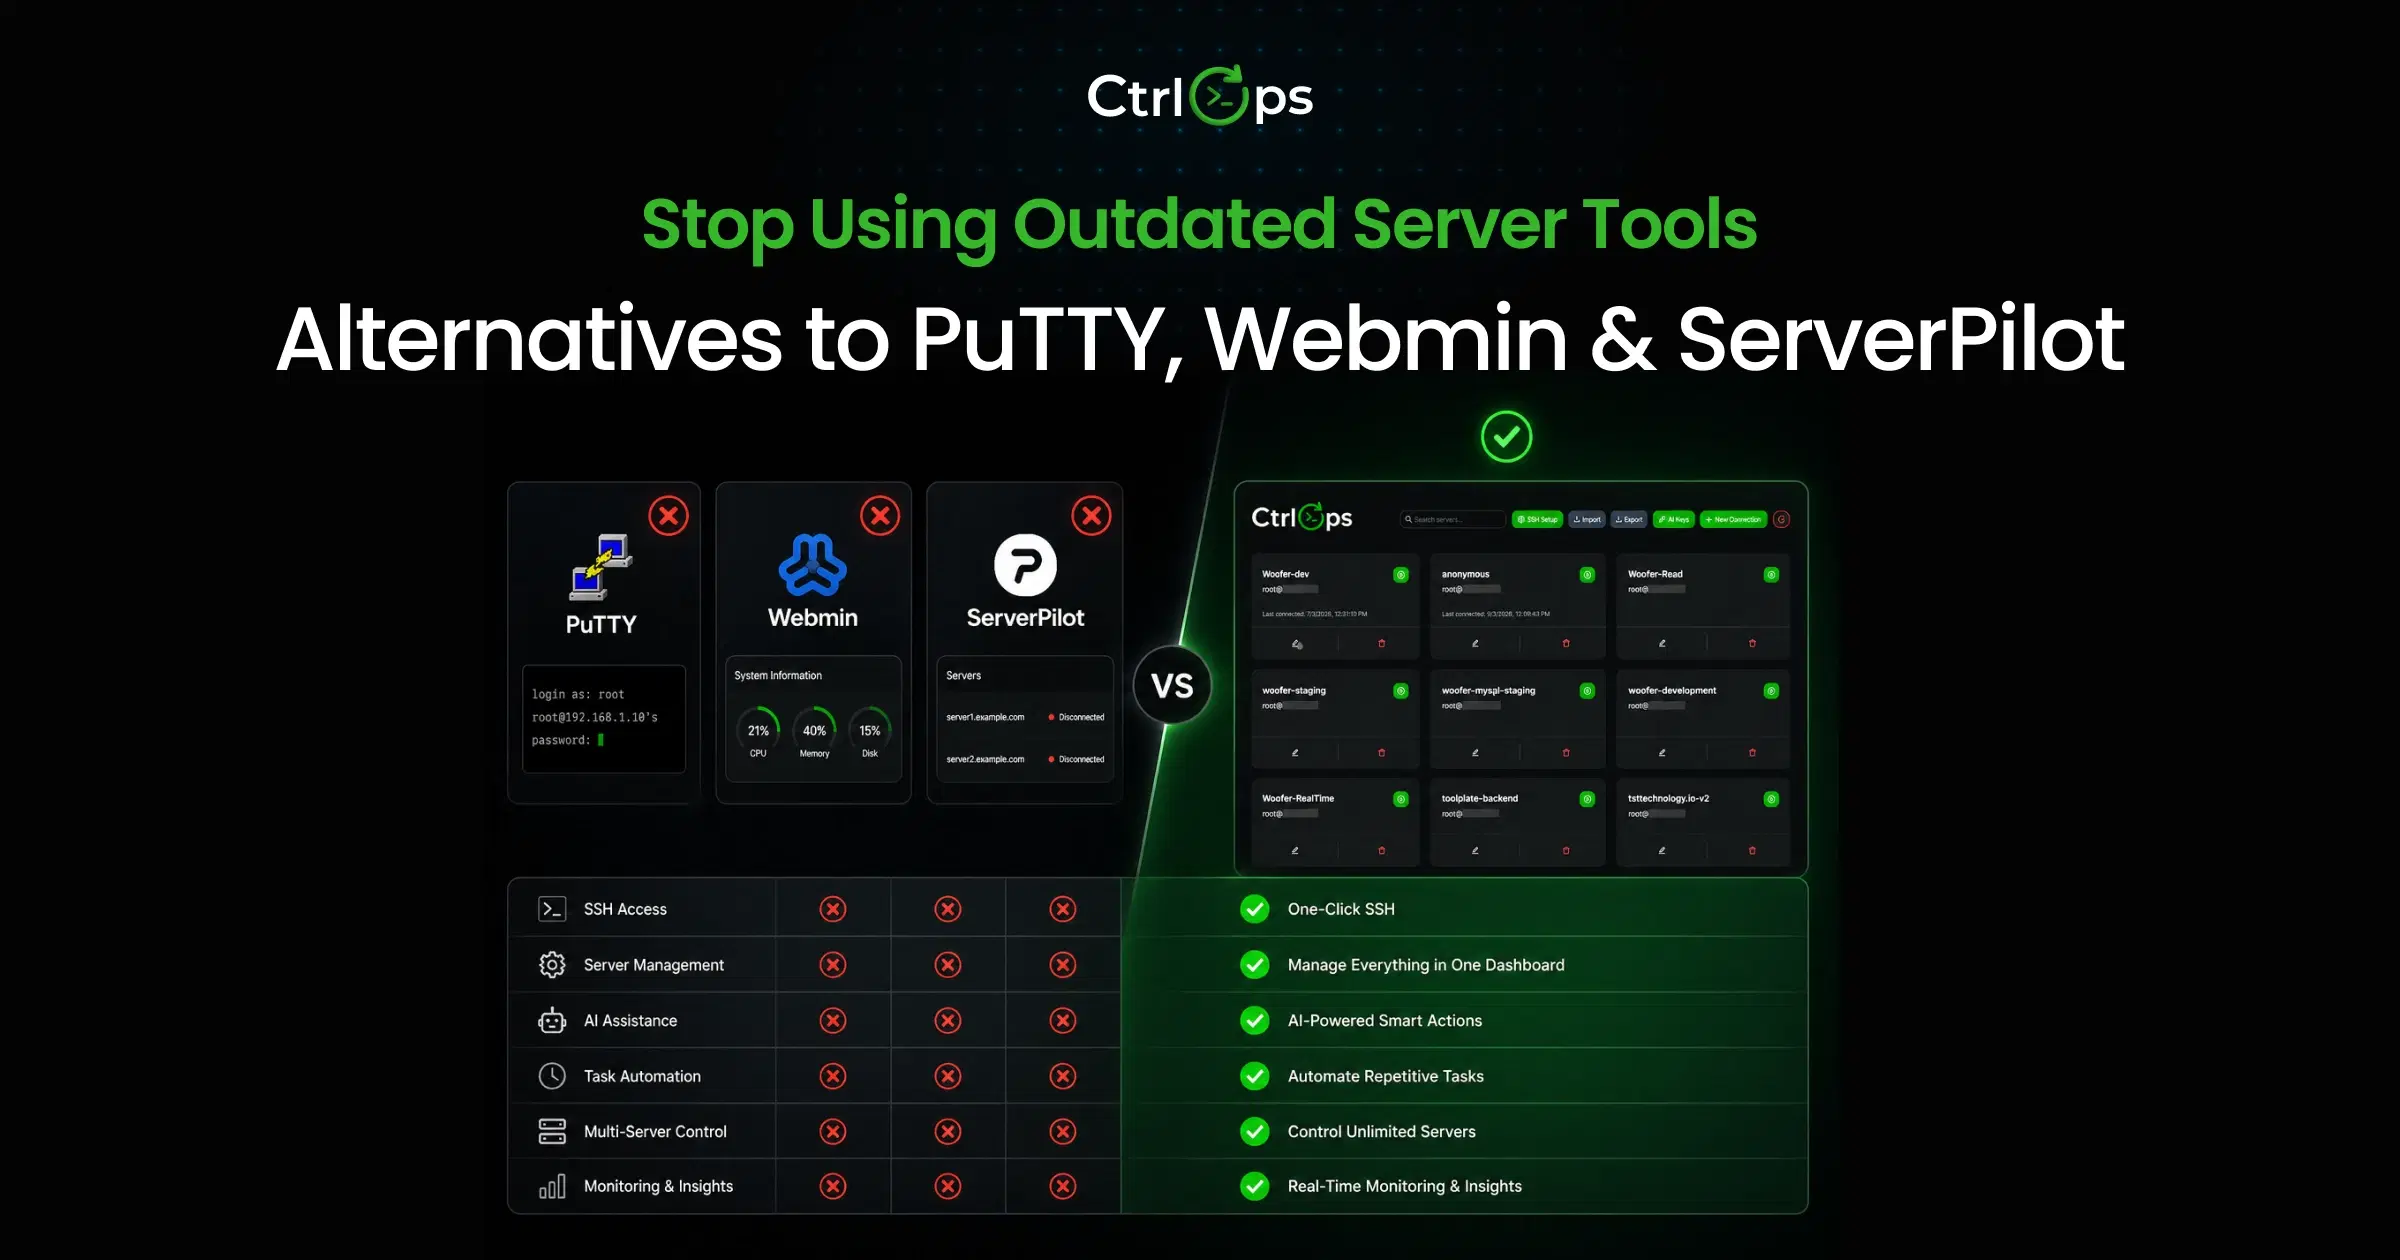
Why You Need a System for Managing Multiple Servers
It was a Friday evening. Eight client servers, one developer, one wrong terminal tab active.
Two hours of incident recovery later, the client was unhappy, and the developer was questioning every tool choice they had made in the past year.
The developer was not careless. The setup was not unusual. The failure was completely predictable. When you manage multiple servers by relying on memory, terminal tabs, and spreadsheets, you are not managing infrastructure. You are managing risk. And risk compounds.
This guide is about replacing that setup with something that actually holds up: the SSH workflows, monitoring habits, and deployment systems that survive the scale from one server to twenty-five.
Why Managing Multiple Servers Becomes Chaos Quickly
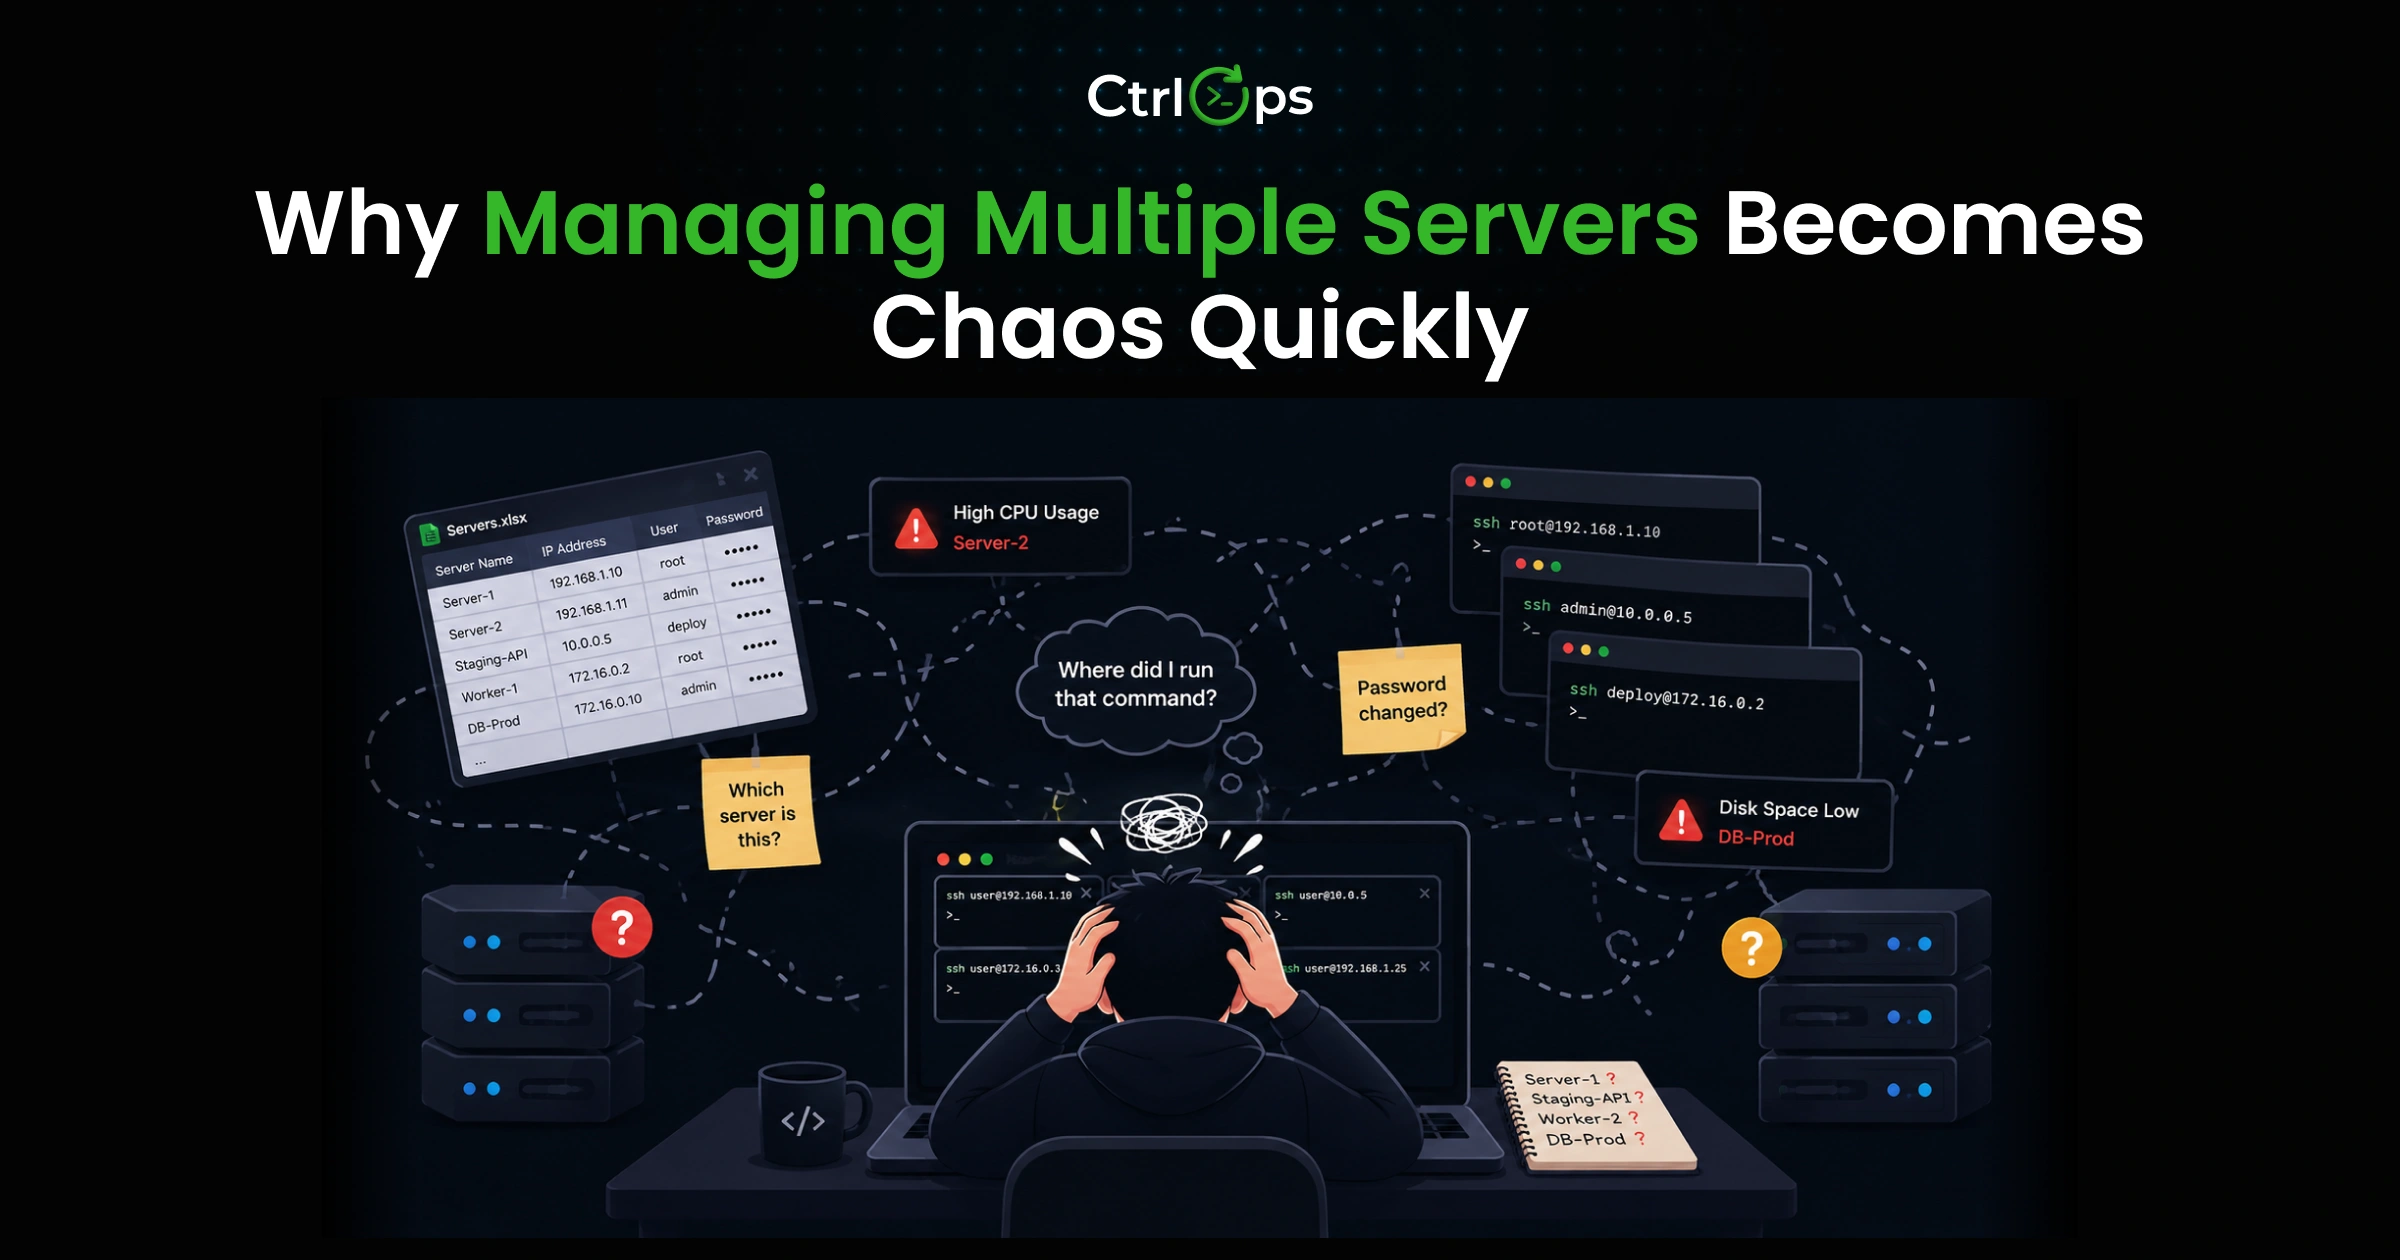
One server is fine. Three is manageable. By six, something has usually broken once. By ten, you have probably had at least one incident that started with "I thought I was on the staging server."
The chaos does not arrive all at once. It builds up one server at a time, one added tool at a time, one manual workaround at a time.
The Spreadsheet and Terminal Tab Problem
Here is the setup most developers end up with when managing five or more servers:
- A Google Sheet with IPs, usernames, ports, SSH keys, and notes like "restart nginx after deploy"
- A terminal with six tabs open, named things like "server1" or "ubuntu@45.33.32.156"
- A separate SFTP app that needs its own credentials every session
- A monitoring dashboard in a browser tab that nobody checks unless something already broke
- A Slack thread with deployment commands from three months ago that may or may not still be correct
Each one of these felt like the right solution to a specific problem at the time. Together, they form a system with no clear owner, no consistent truth, and no way to catch mistakes made under pressure.
What breaks first:
- The spreadsheet goes stale within weeks
- Terminal tabs get renamed or closed by accident
- The SFTP app is never open when you actually need it
- The monitoring dashboard gets skipped because opening it takes effort
- The Slack thread is impossible to search mid-incident
When everything is running fine, this works. The moment something goes wrong, it falls apart exactly when you need it most.
Bottom line: Every tool you add to patch a gap creates a new gap: another credential to maintain, another context to switch into, another place where information goes stale. The answer is not more tools. There are fewer tools doing more.
No Visibility Across Your Servers
Here is a direct question: right now, without SSH-ing into each server, do you know the current disk usage across everything you manage?
Most developers do not. They find out:
- A server is low on disk because the app starts throwing 500 errors
- Memory is maxed because response times go from 200ms to 4 seconds
- A process has been dead for six hours because a user filed a support ticket
This is not about being careless. It is the natural result of a setup where checking server health requires individual SSH sessions and manual commands. When every check costs two minutes per server, you only check when you already suspect something is wrong.
By then, you are already in recovery mode.
Context Switching Kills Productivity
Every time you switch between tools, your brain has to rebuild context. Parnin and Rugaber's analysis of 10,000 programming sessions found developers spend 15 to 30 minutes reconstructing context before resuming an interrupted task, and UC Irvine's Gloria Mark measured an average of 23 minutes to fully refocus after an interruption.
Key numbers that put this in perspective:
- Only 10% of interrupted programming sessions resume productive work in under a minute - the rest lose real time to context rebuilding
- The average knowledge worker toggles between applications over 1,200 times per day, per Harvard Business Review research
- Atlassian's research on context switching identifies tool fragmentation as one of the biggest productivity killers for dev teams
When you are bouncing between a terminal, SFTP app, monitoring tab, and shared doc to complete a single deployment, you are not just losing time. You are increasing the odds of a mistake.
Real Example: Managing 8 to 15 Servers Manually
Picture a freelance developer managing infrastructure for four clients:
- Client A: production + staging
- Client B: production + staging + database server
- Client C: one production machine
- Client D: two new servers for a feature launch
That is nine servers. Different SSH keys per client. Three different Linux distros. Mix of Nginx, Caddy, and Apache. Deployments done by SSH-ing in and running commands from a Notion doc that has three versions because three developers each updated their own copy.
A Friday afternoon hotfix deployment looks like this:
- Open Notion to find the deployment commands for Client B production (context switch 1)
- Open the spreadsheet to find the correct IP (context switch 2)
- Open terminal, SSH in, realize you are in Client A's production tab by mistake
- Close it, open a new tab, SSH into the correct server
- Run deployment
- Open SFTP app to verify the config file (context switch 3)
- Open monitoring tab to confirm the service came back up (context switch 4)
- Update the deployment log somewhere else (context switch 5)
Five context switches for one deployment. Multiply that by three servers. Add in a config edit. A 15-minute task becomes an hour, with a near-miss already baked in.
Reality check: When a client calls at 2 AM because their app is down, you do not need a scavenger hunt through spreadsheets, Slack threads, and terminal tabs. You need instant access. Every second you spend hunting for the right IP or the right key is a second their business is bleeding.
What Actually Breaks When You Manage Multiple Servers at Scale
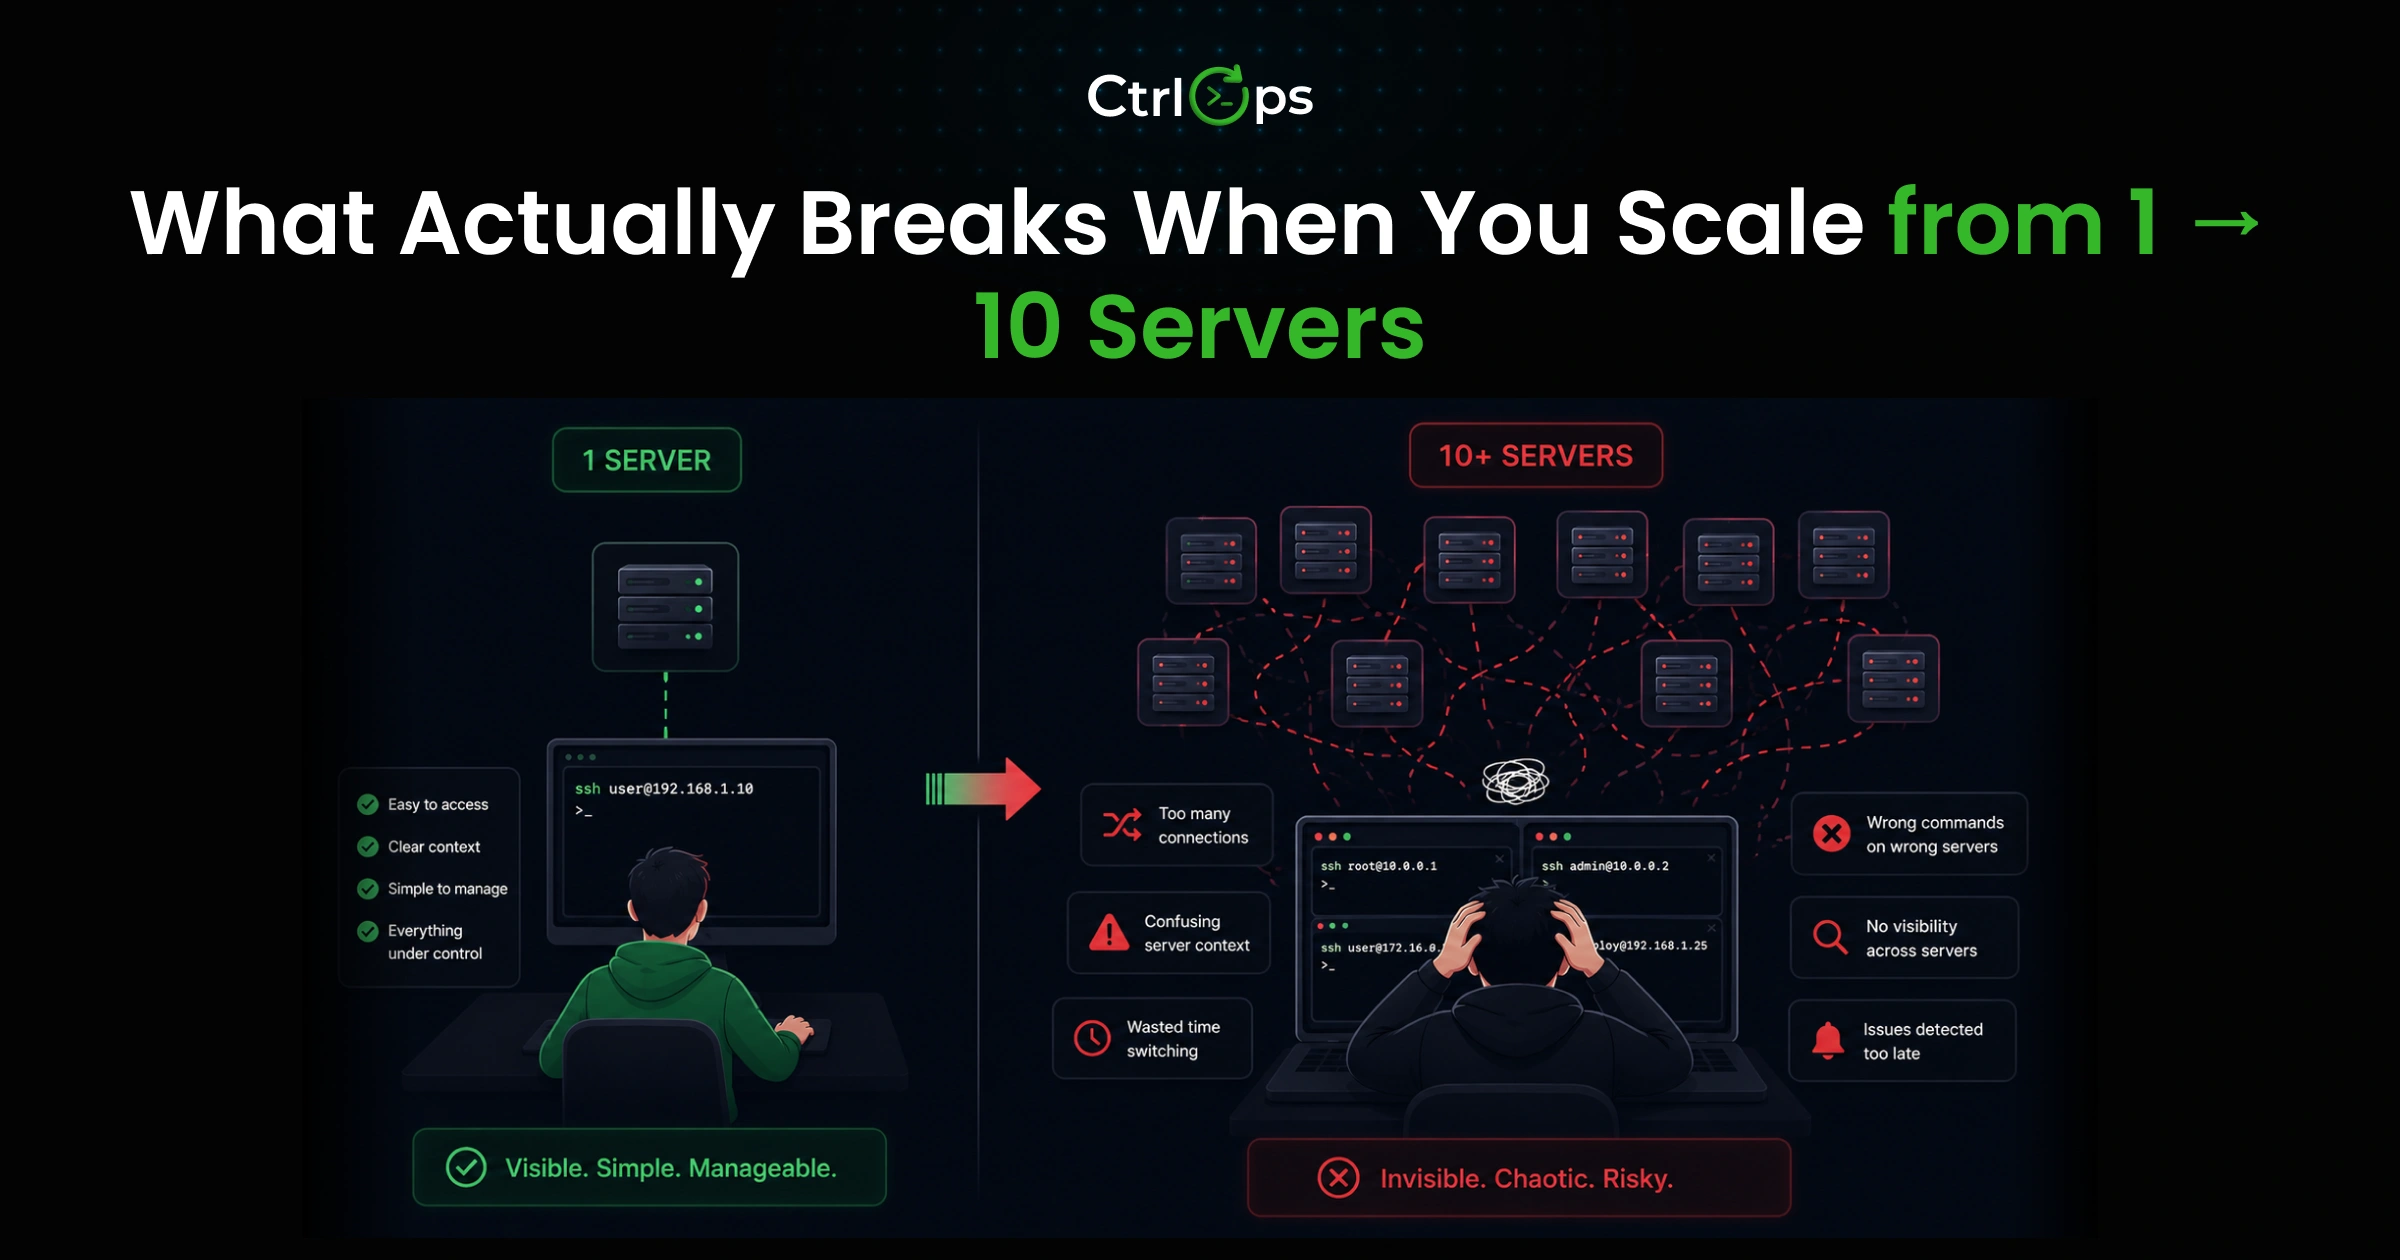
Scaling from one or two servers to ten does not just multiply your effort. It introduces failure modes that do not exist at the small scale.
SSH Connection Confusion
With one server, you always know what you are connected to. With ten, you are one wrong terminal tab away from:
- Running a production restart on staging
- Deleting a directory on the wrong machine
- Pushing a deployment to the wrong environment
The failure mode is subtle because it feels fine right up until it does not.
The technical fix is SSH config aliases: readable names instead of raw IPs. The better fix is a system where you see "acme-prod-web" and know exactly what you are connecting to before you run anything.
At midnight, tired, you will run commands on the wrong server. It is not a question of if. It is when. The only protection is a system that makes wrong-server connections visually impossible, not just unlikely.
Deployment Inconsistency Across Servers
Manual deployments look different depending on who runs them:
- One developer does
git pullthen restart. Another restarts, then pulls (brief downtime every time). - One clears the cache. Another does not.
- One updates environment variables first. Another forgets.
When something breaks in production and the question is "what changed?", the honest answer is: "depends on who deployed it and when."
This inconsistency also creates configuration drift:
- Config files get edited on the server and never committed to the repo
- Environment variables updated on production but not staging
- Dependencies updated on one server, forgotten on three others
This is the root cause of the entire class of bugs that "only reproduce in production."
Bottom line: Manual deployments are not a process. They are a series of individual decisions made under varying conditions by different people. That is not repeatable. And things that are not repeatable will eventually fail in ways you cannot predict.
Monitoring Gaps and Late Detection
Without proactive monitoring, you find out something is wrong from your users, not from your infrastructure:
- User reports the site is slow: you SSH in, find the disk at 98% from two months of unrotated logs
- Feature stops working: background worker has been dead for six hours
- Support tickets spike: Node process crashed when the disk hit 100%
The disk filling from 70% to 95% is entirely observable. It happens slowly and predictably. A monitoring setup that shows you this catches the problem days before it becomes an incident. The reason most small teams skip this is not that monitoring is hard. It is that setting it up properly across multiple cloud providers takes time most teams redirect to product work.
Why These Problems Compound Over Time
Here is the chain that makes this genuinely dangerous over time:
- SSH confusion causes an incident
- Incident requires an emergency manual fix under pressure
- Emergency fix is undocumented
- Undocumented fix creates configuration drift
- Drift makes monitoring harder to interpret
- You miss the next early signal
- Repeat
The team's most experienced developer gradually becomes the single point of failure. The only one who knows which server is which, which deployment command is current, and where to start at 11 PM when something breaks. That is both a business risk and a path to burnout.
Bottom line: Every problem described above comes from one root cause: decisions stored in memory instead of systems. Move the knowledge into the system and most of these problems will solve themselves.
What Efficient Multi-Server Management Actually Looks Like
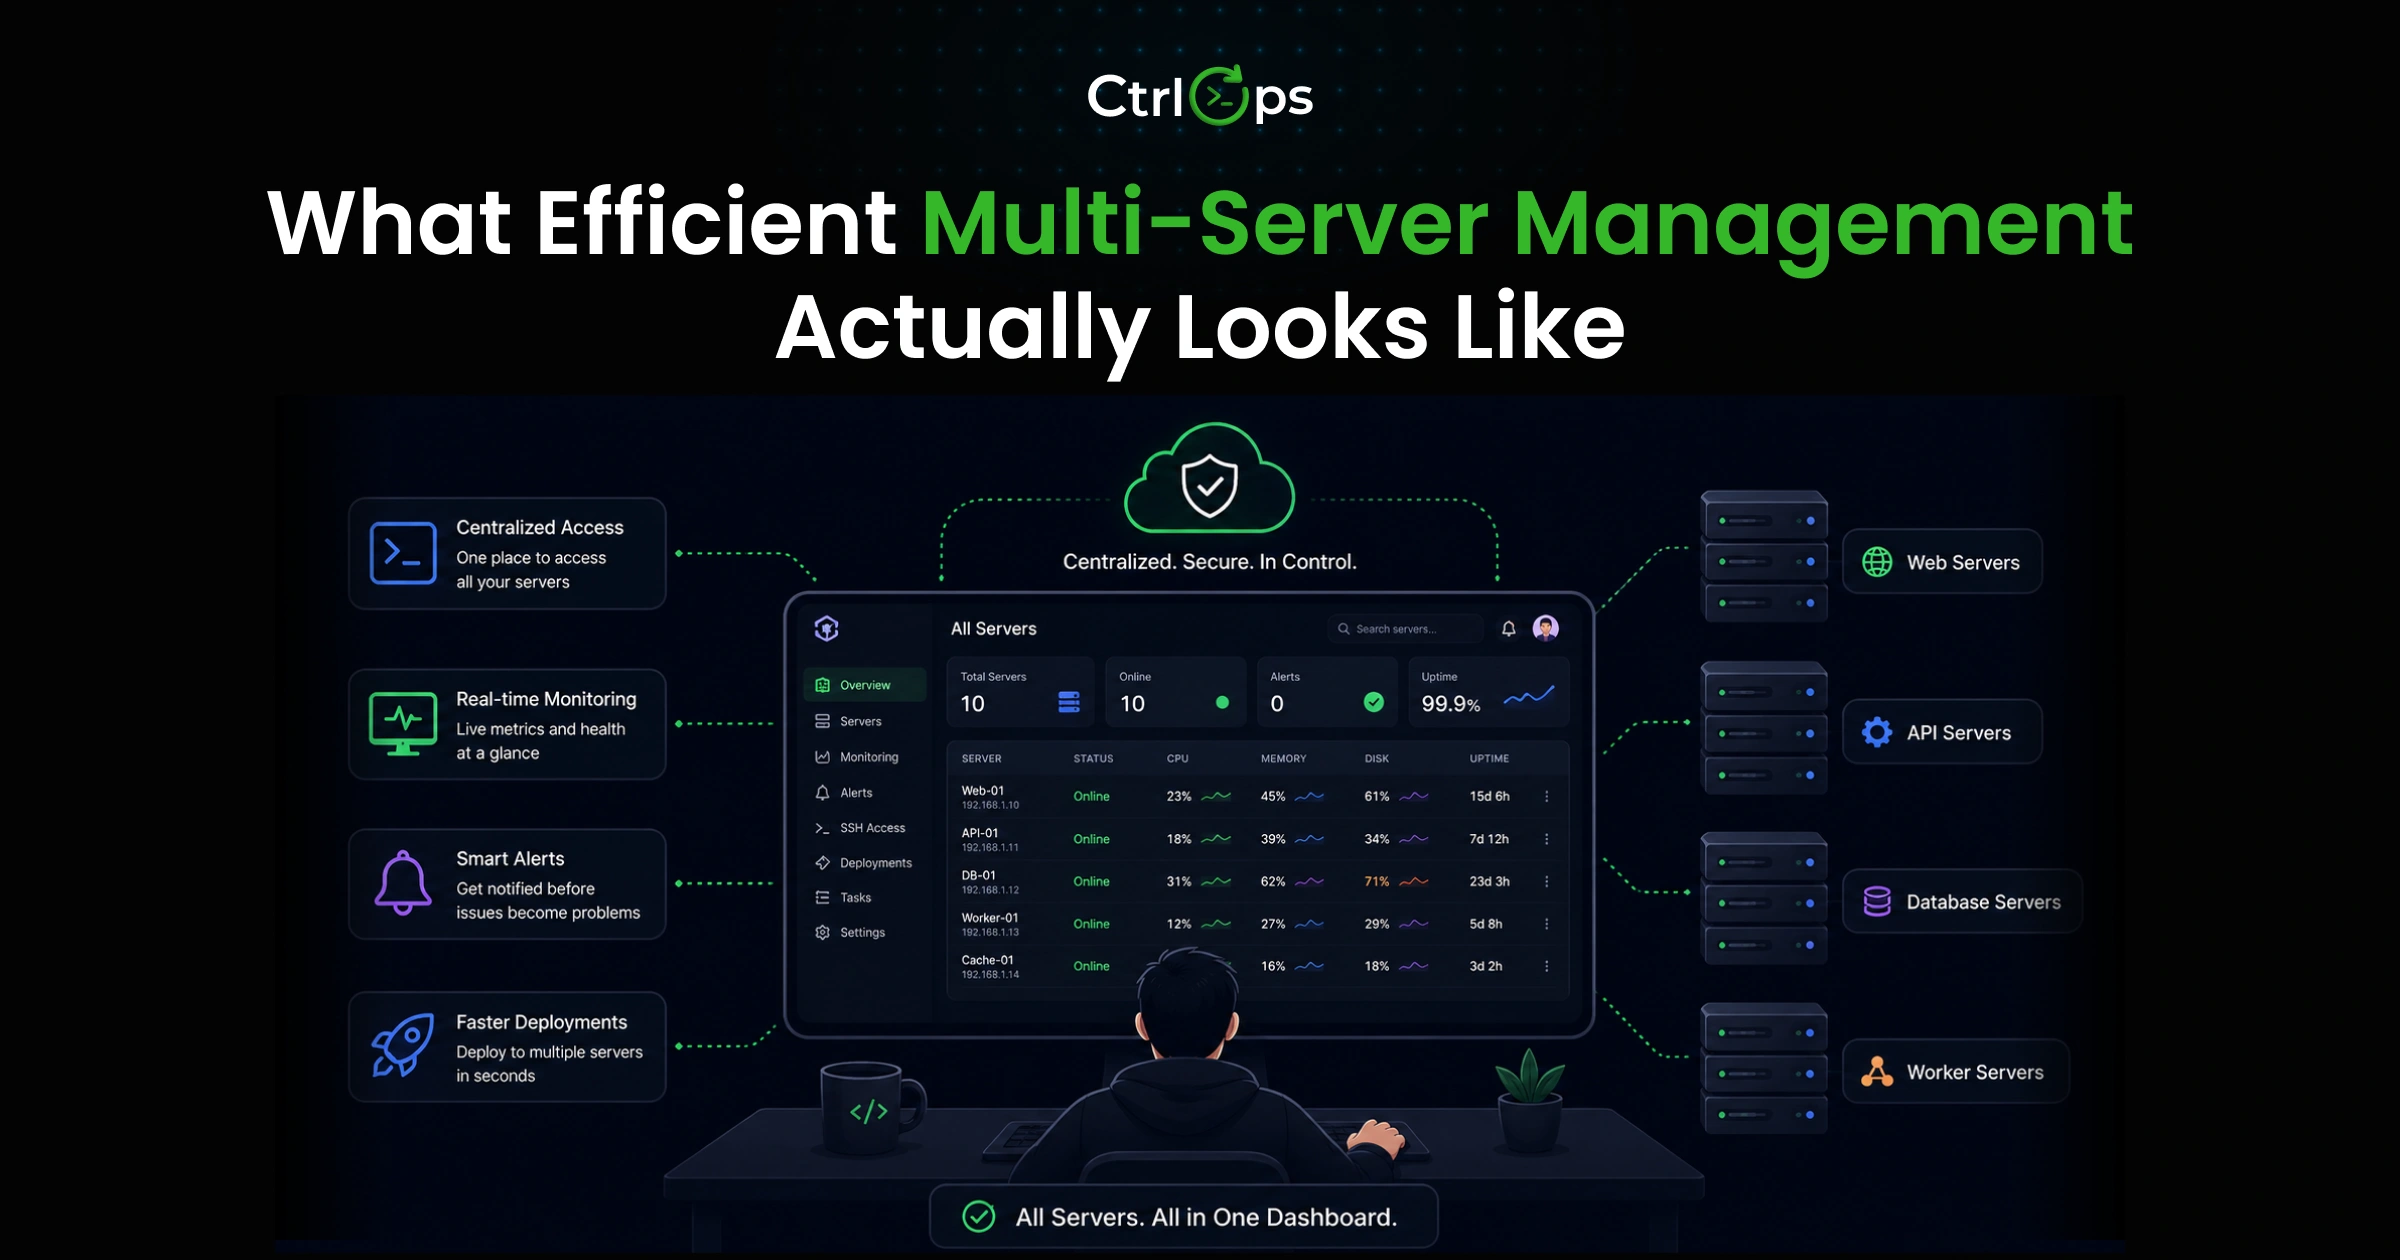
Efficient multi-server management has four characteristics. Most manual setups achieve none of them consistently.
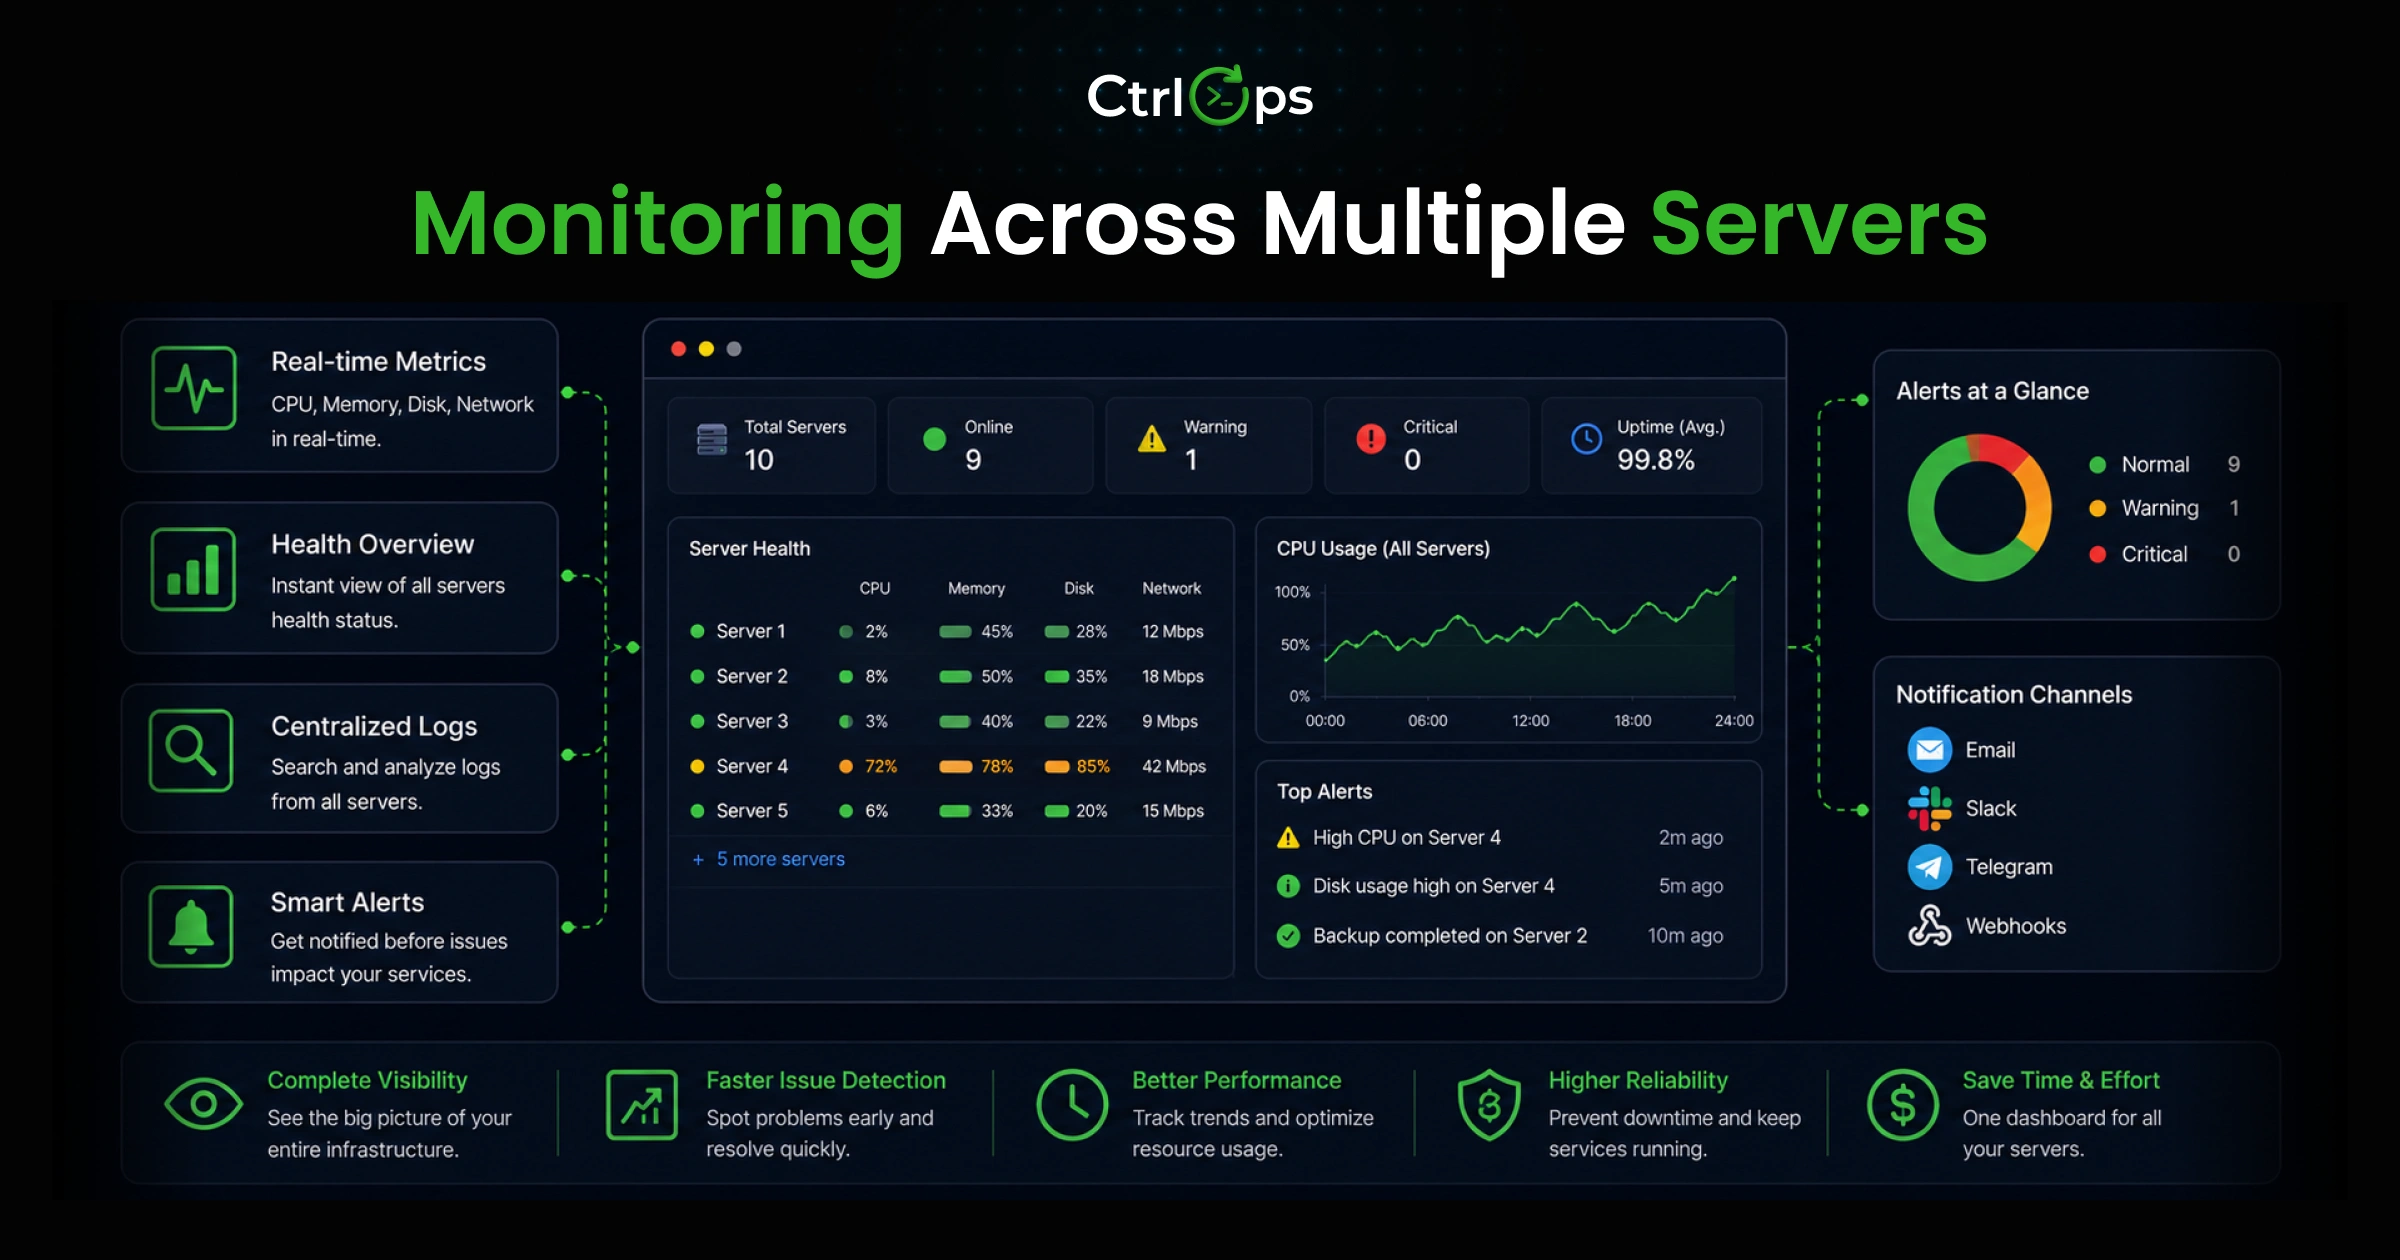
Centralized Server Visibility
Every server you manage should be visible in one place:
- Name and environment (not raw IP)
- Connection status
- Last connected timestamp
- At-a-glance health metrics (CPU, RAM, disk)
Not in a spreadsheet that goes stale. Not scattered across tabs. Not in your memory. One view, always current.
When you can see the state of your entire fleet at a glance, you stop being reactive. You start catching patterns before they escalate.
Named SSH Access With No IP Chaos
Your connection system should use human-readable names:
acme-prod-webtells you exactly what you are connecting tossh ubuntu@203.0.113.45requires you to correctly recall which IP, which key, which username
This distinction matters most under pressure. When something is broken and you are moving fast, connecting to the wrong server can make the incident worse. A named system removes this class of mistake by design, not by discipline.
Integrated File Management
File management and your terminal should live in the same application. Opening a separate SFTP app to edit a config file on a server you are already SSH-ed into is not just inefficient. It is a context switch with a cognitive cost every time.
Same for monitoring. If checking server health requires opening a different browser tab, you will check it less often. Less often means more missed signals. More missed signals means more incidents.
Fast Movement Between Servers
Moving between servers should take seconds. Click the name, connect, work. Not:
- Find the IP in a spreadsheet
- Open a new terminal tab
- Type the SSH command
- Enter the passphrase
- Navigate to the working directory
The goal: the server identity is the only variable. Everything else stays consistent and fast.
Traditional Workflow vs Modern Workflow
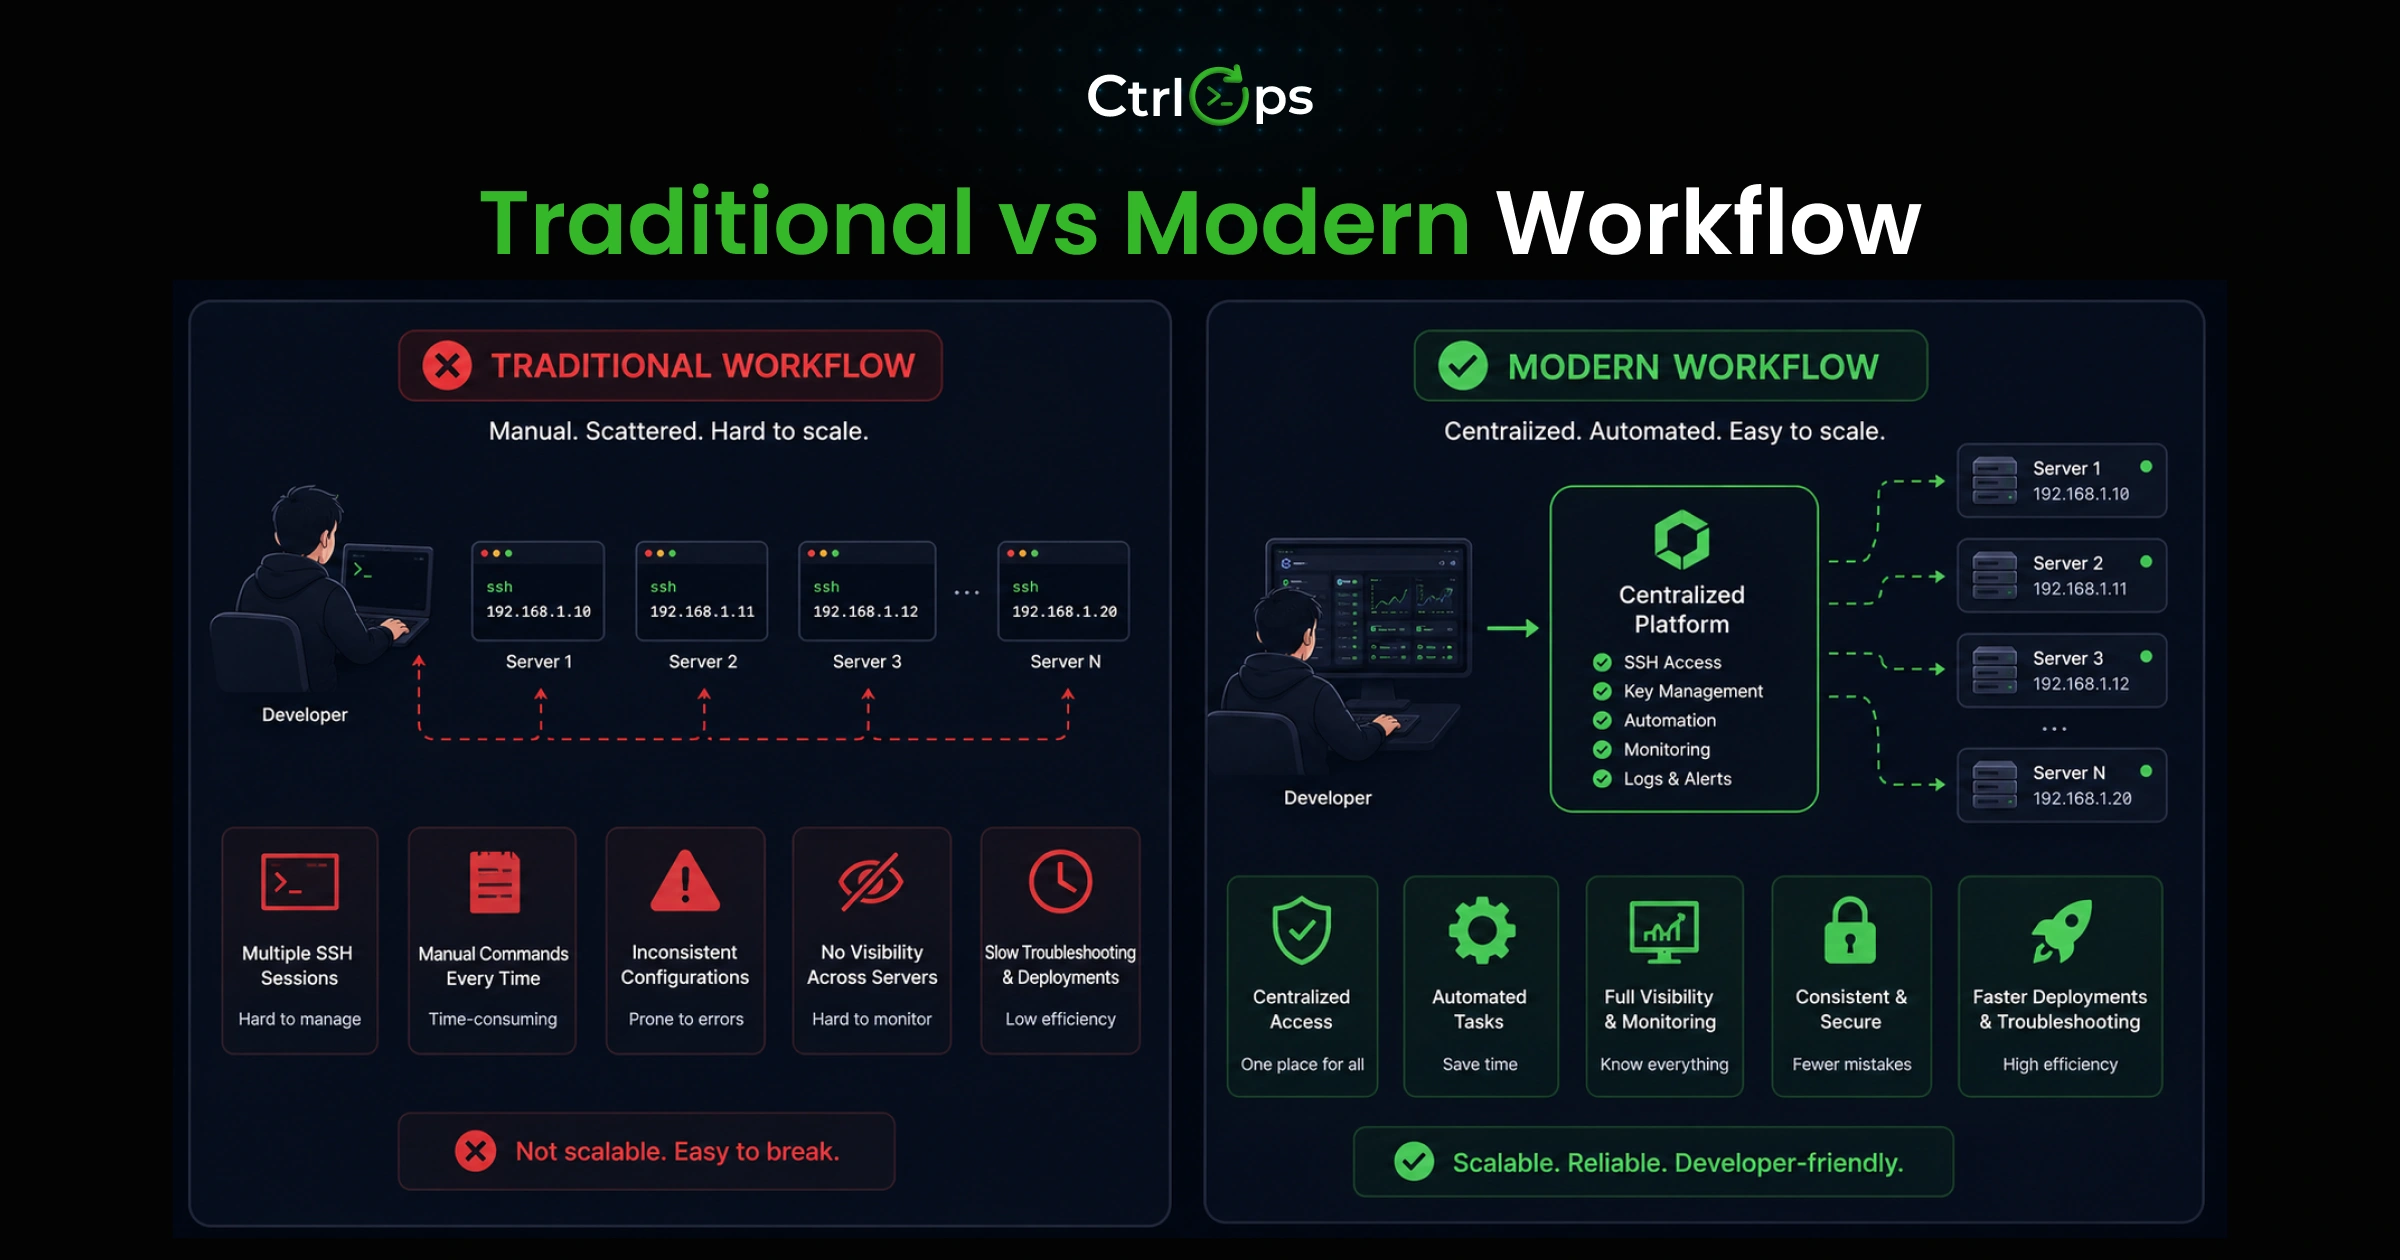
Traditional Setup
| Task | Tool |
|---|---|
| SSH access | Terminal with named (or unnamed) tabs |
| File management | Separate SFTP app with its own credentials |
| Server monitoring | Browser-based dashboard, rarely checked |
| Server info | Google Sheet or Notion doc, inconsistently updated |
| Deployment commands | Slack thread or shared doc with multiple versions |
A single deployment with this setup:
- Open Notion to find the IP and commands (context switch 1)
- SSH into the server (context switch 2)
- Run deployment
- Open SFTP app to verify config (context switch 3)
- Open the monitoring tab to confirm health (context switch 4)
- Update the deployment log (context switch 5)
Five context switches. Each one costs 15 to 30 minutes of recovered focus time.
Modern Setup with CtrlOps
| Task | What changes |
|---|---|
| SSH access | Click server name in the directory, connect in one click |
| File management | File manager opens alongside the terminal, no separate app |
| Server monitoring | Infra panel visible in the same interface, always |
| Deployment | Wizard handles the process end-to-end with validation |
| AI assistance | Describe the task in plain English, review before running |
The same deployment:
- Click the server name
- Run deployment via the built-in wizard
- Check the infra panel to confirm a healthy status
Three steps. Zero context switches.
Comparison
| Factor | Fragmented setup | Unified workflow with CtrlOps |
|---|---|---|
| Time per deployment | 35 to 60 min | 8 to 12 min |
| Context switches per task | 4 to 5 | 0 |
| Wrong-server risk | High (tab confusion) | Low (named, visual connections) |
| New developer onboarding | Half a day | Under 20 min |
| Mental load | High (tracking info across tools) | Low (one context) |
Five deployments per week: that is roughly 135 minutes per week recovered. Over a year, more than 100 hours.
The risk difference matters more. Studies of interrupted programming work consistently find that fragmented attention raises both recovery time and error rates - most interrupted tasks lose 15 to 30 minutes of context rebuilding before productive work resumes.
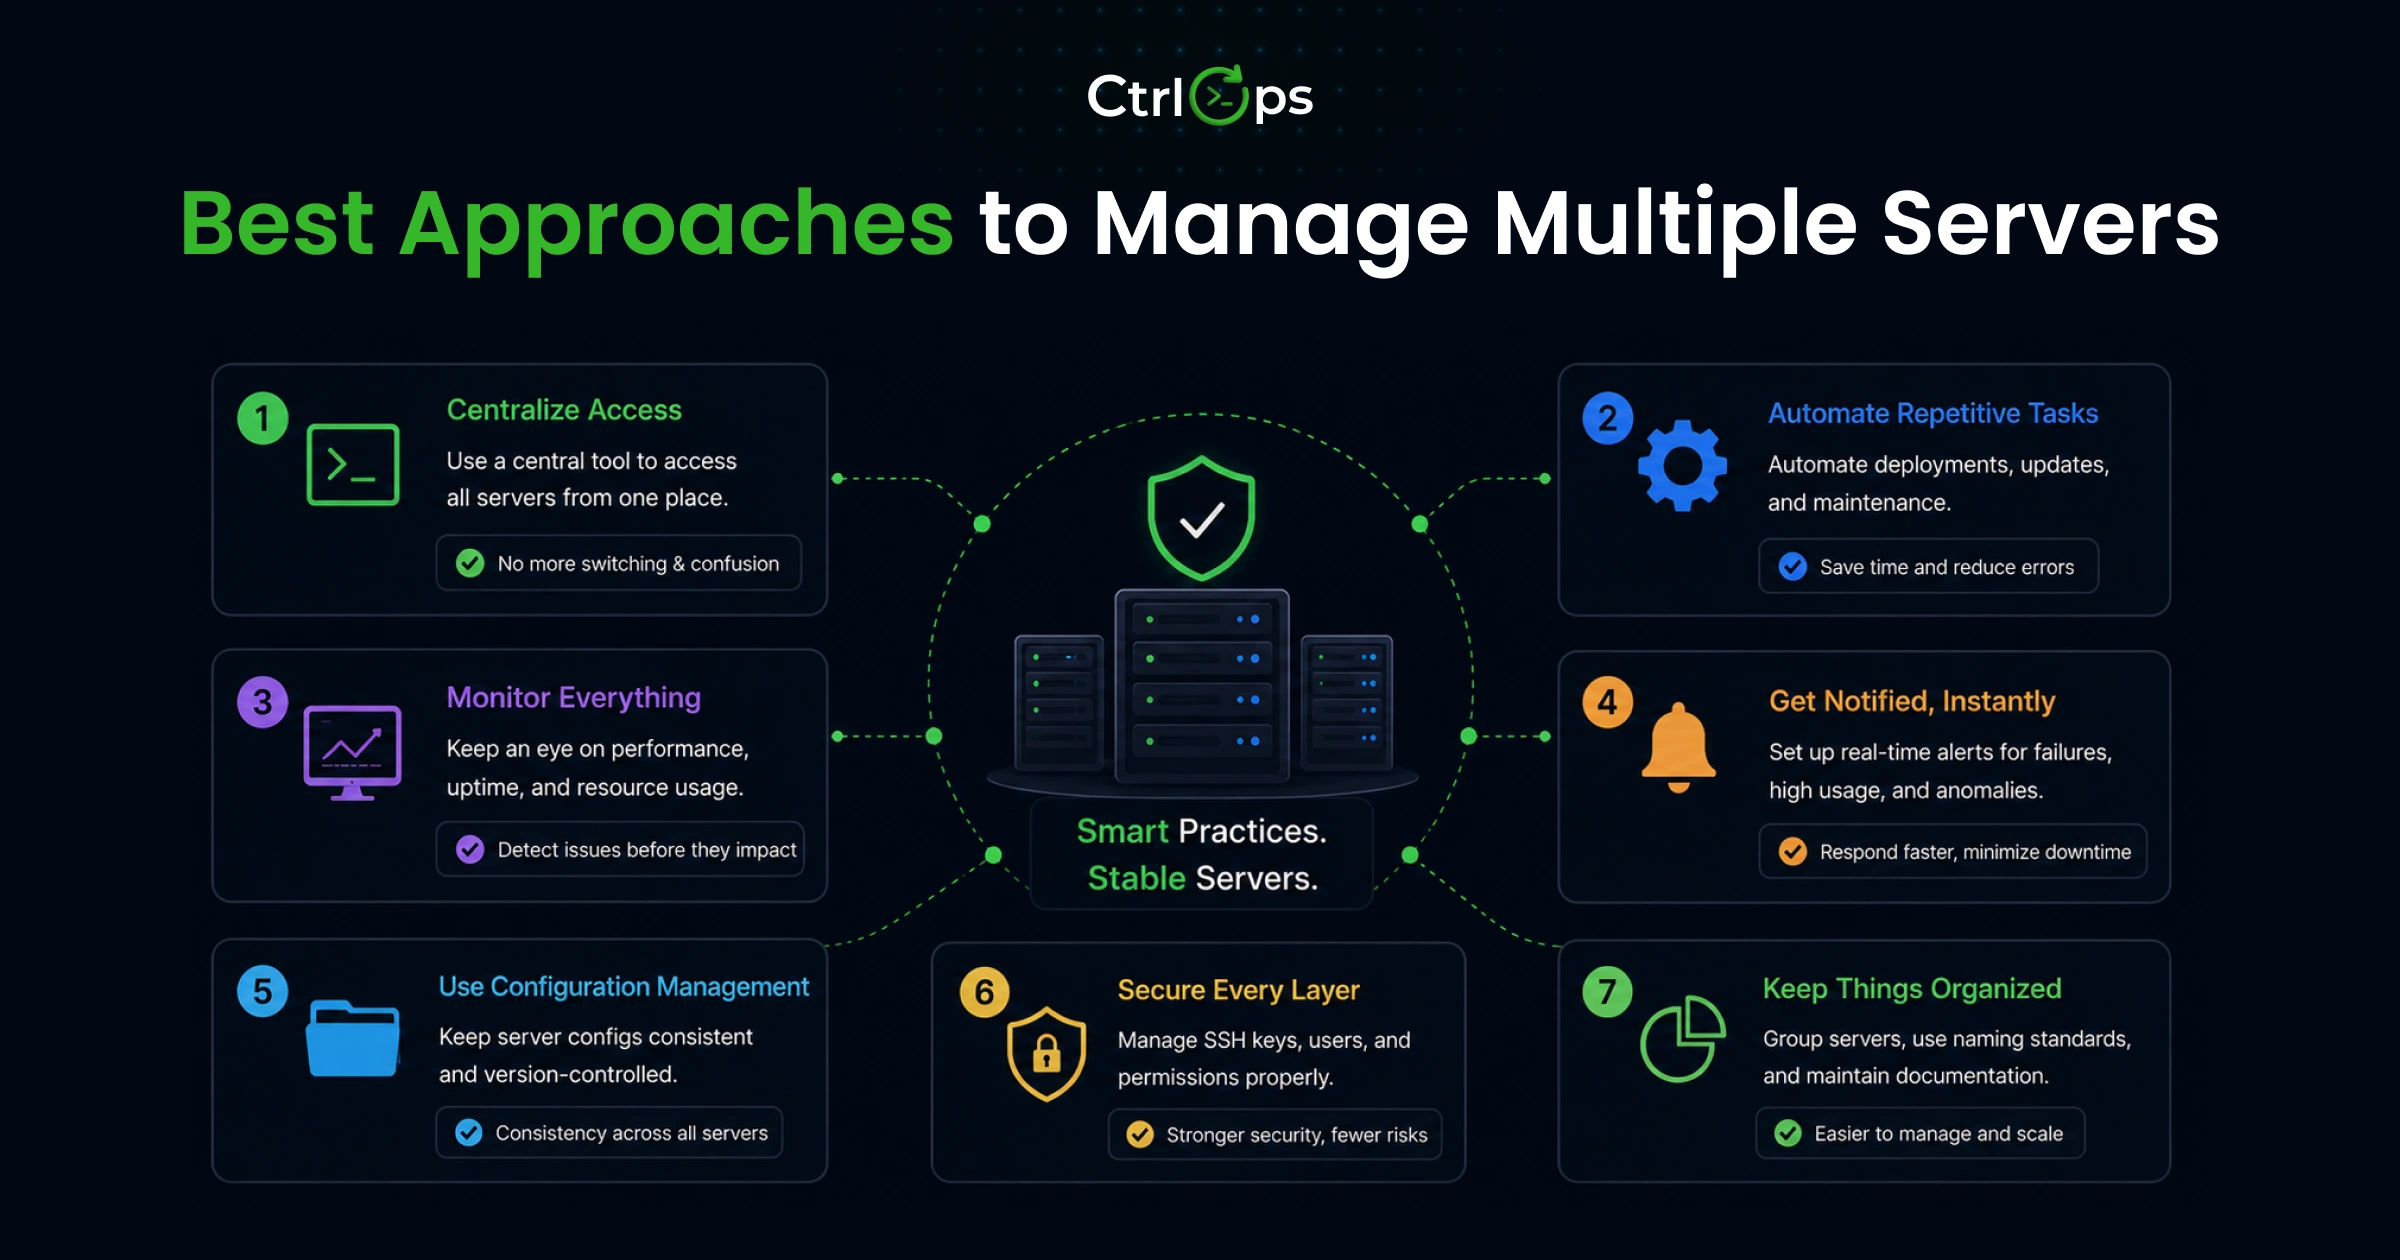
Best Approaches to Manage Multiple Servers
1. Manual SSH and Scripts
What it is: Terminal access, SSH keys, and scripts you have built up over time.
What works:
- Maximally flexible, no additional tooling required
- Works well if you are a solo developer who knows the infrastructure deeply
- Good starting point before anything grows
What breaks:
- Scripts fail silently when the environment changes
- Infrastructure knowledge lives in people's heads and leaves when they do
- Getting a new team member up to speed requires significant manual setup per server
Best for: Solo developers managing two or three stable, personal servers.
2. SSH Clients with Tabs (iTerm2, Termius)
What it is: A dedicated SSH client with session management, named connections, and multi-tab support.
What works:
- Named connections remove the IP memorization problem
- Tabs make multi-session access more organized
- The SSH part of the workflow improves meaningfully
What it does not solve:
- File management is still a separate application
- Monitoring is still a separate tab or a manual SSH session
- Deployment is still manual
You organized one piece of a four-part problem. The other three stayed exactly the same.
Best for: Developers who primarily need organized SSH access and rarely do file management or deployments.
3. Monitoring + SSH + File Tools Combination
What it is: Best tool for each job: dedicated SSH client, SFTP app, monitoring platform, deployment pipeline.
What works:
- Each component does its specific job well
- Powerful at scale with dedicated infrastructure staff
What breaks:
- Four tools mean four places to update credentials when a server changes
- Four interfaces to maintain, four configurations that drift out of sync
- High onboarding cost for new team members
- High maintenance overhead for anyone not exclusively working on infrastructure
Best for: Teams with dedicated DevOps staff who have time to maintain and evolve a multi-tool setup.
4. Unified Desktop Tool (CtrlOps)
What it is: One desktop application handling SSH management, file browsing, infrastructure monitoring, an AI-assisted terminal, and deployment automation.
What works:
- One credential store, one interface, one context across every server management task
- File manager opens alongside the terminal, no separate SFTP connection needed
- Infra Details panel shows live CPU, RAM, disk per server, no agent installation required
- AI Terminal generates commands from plain English, requires your review before anything runs
- Add Application wizard handles Node.js, React, Next.js deployments end-to-end (Nginx, PM2, SSL, env vars)
- Everything local, AES-256 encrypted, no cloud sync
The trade-off:
- You are in one tool rather than best-in-class specialized tools
- At 30+ servers with dedicated ops staff, specialized tools become more appropriate
Best for: Developers, freelancers, and startup teams managing 3 to 25 servers who want reduced context switching and faster deployments without dedicated infrastructure staff.
Before deciding on tool consolidation, count the number of application switches in your last three server management tasks. If the answer is consistently more than three per task, the context-switching cost alone is likely costing you several hours of productive work every week.
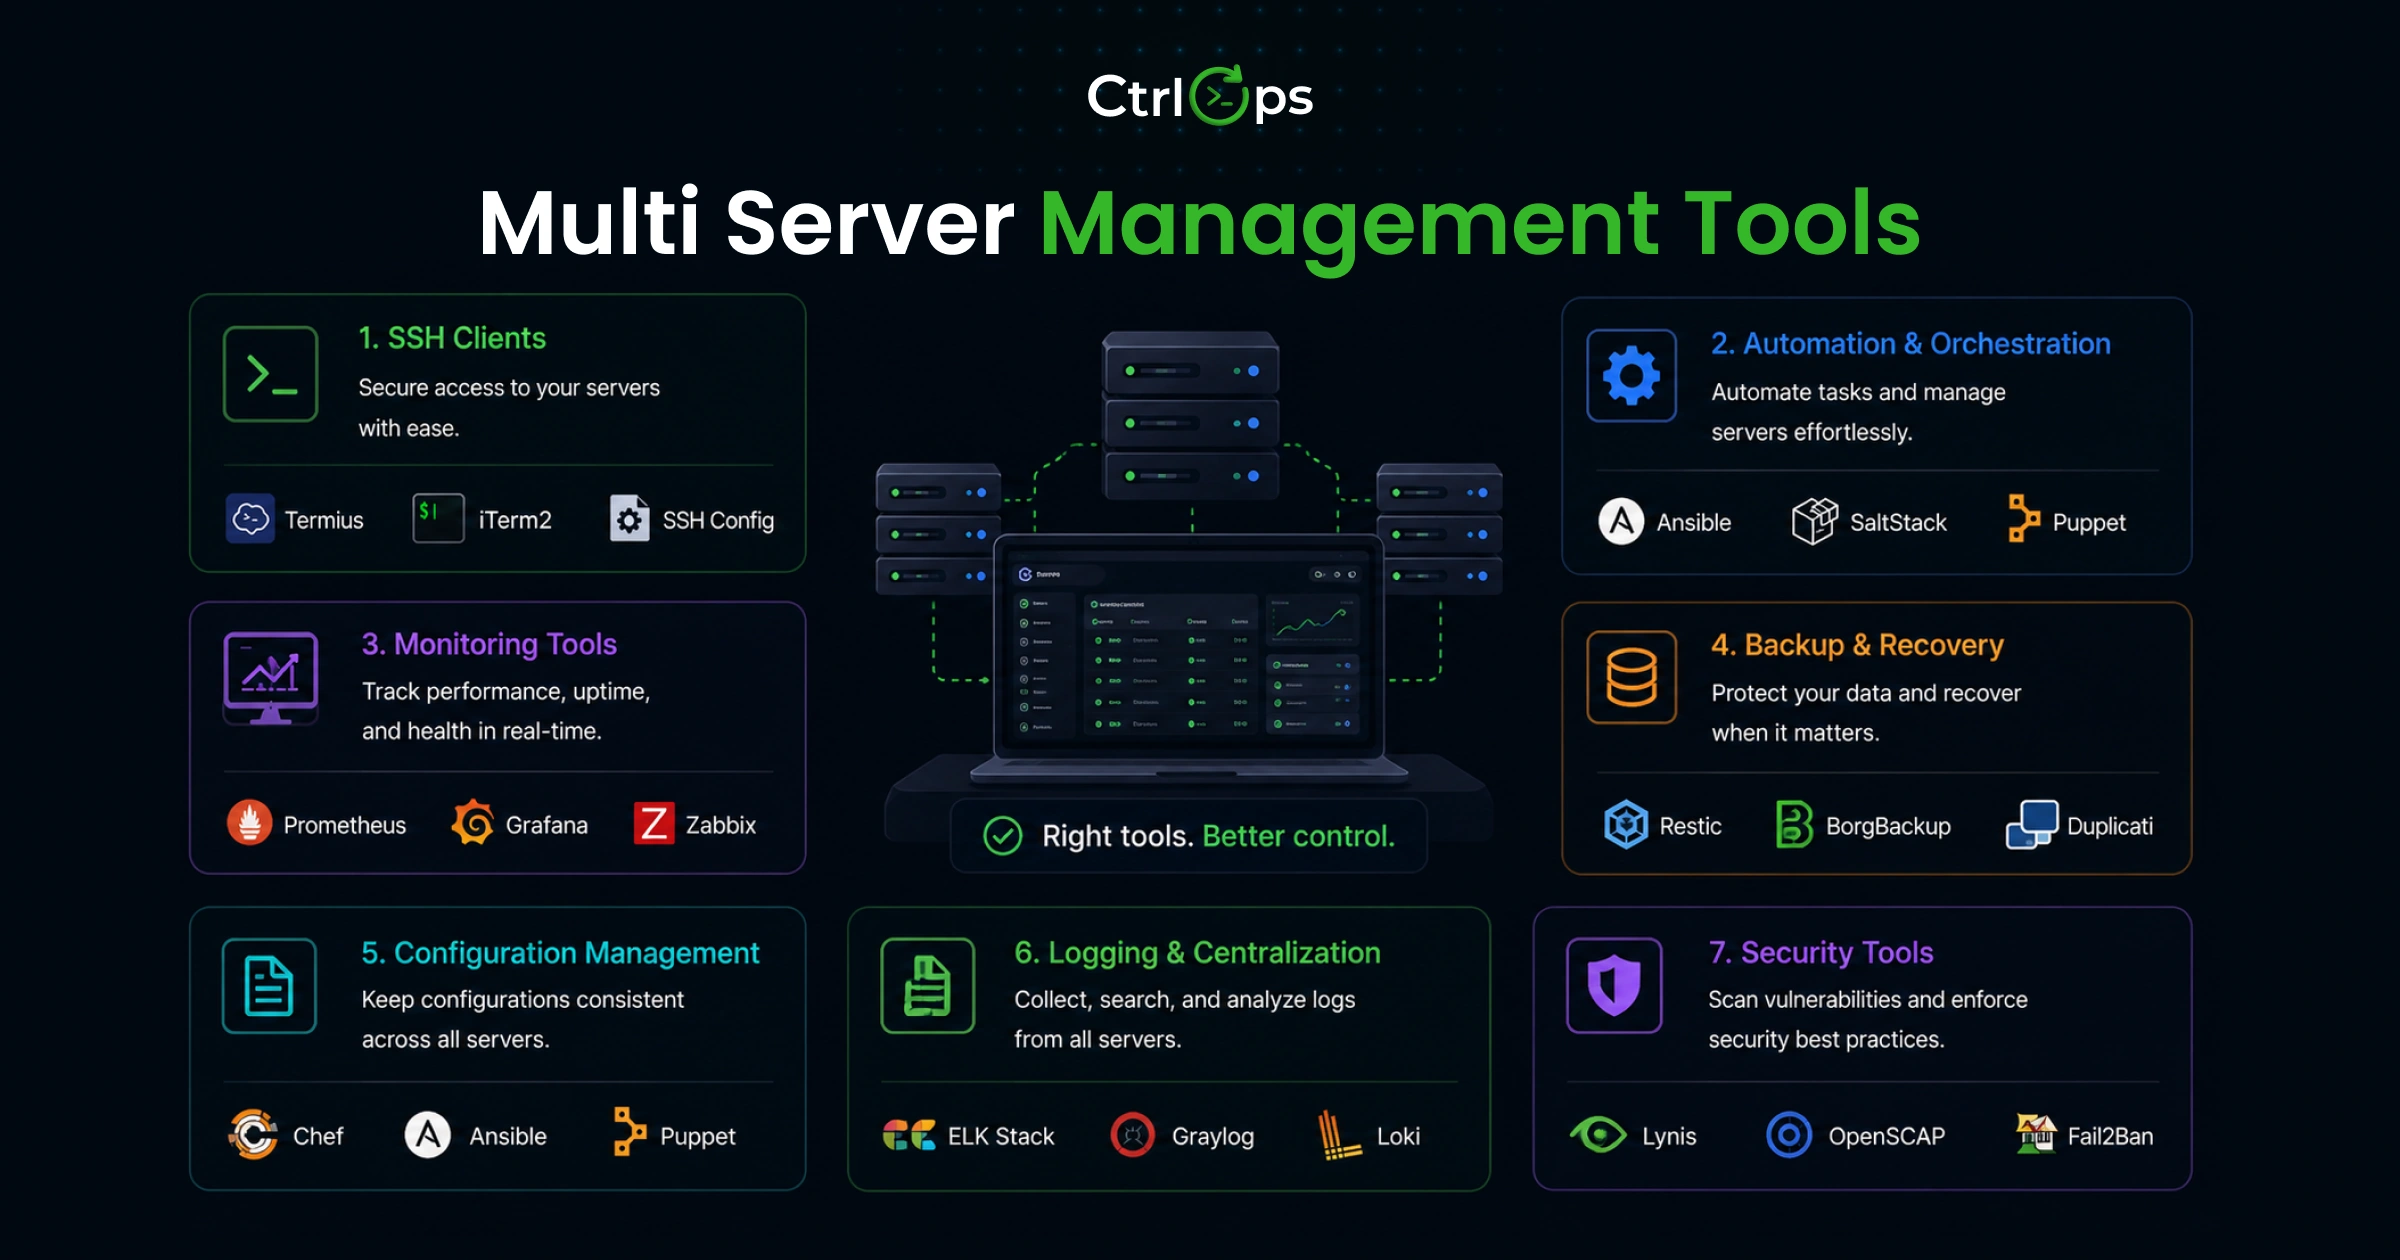
Multi-Server Management Tools That Actually Help
SSH Connection Managers
| Tool | Platform | Price | Best for |
|---|---|---|---|
Native OpenSSH + ~/.ssh/config | All | Free | Power users comfortable with text config |
| Termius | All + Mobile | $10/mo | SSH access from phone, cross-device sync |
| Tabby | All | Free | Local storage, open source, modern UI |
| CtrlOps | Mac, Win, Linux | $7/mo | SSH + files + monitoring + deployment in one |
Native OpenSSH: Pre-installed everywhere. A well-structured ~/.ssh/config handles named hosts and key routing automatically. No GUI, no fleet visibility.
Termius: Best mobile SSH experience available. Credentials sync through their cloud vault (end-to-end encrypted, but cloud-dependent and account-required). Good if phone access is a real need.
Tabby: Free, open source, modern interface. Local credential storage. Solid if you want free and private.
CtrlOps: Desktop app integrating SSH, file management, monitoring, and deployment. Local-first. $7/month flat for unlimited servers.
Server Monitoring Tools
| Tool | Type | Price | Agents required |
|---|---|---|---|
| htop / top | CLI, per-server | Free | No (built into Linux) |
| Netdata | Self-hosted dashboard | Free | Yes, per server |
| Uptime Kuma | Self-hosted uptime monitor | Free | No |
| Datadog / New Relic | Enterprise SaaS | $15 - $30+/host | Yes |
| CtrlOps Infra Details | Built into app | Included | No |
htop/top: Good diagnostic tools once you know something is wrong. Require SSH-ing into each server individually. No fleet-level view.
Netdata: Good open source dashboards with historical data. Needs installation and maintenance on each server.
Uptime Kuma: Excellent for service uptime and alerting. Does not provide detailed resource metrics.
Datadog/New Relic: Enterprise-grade. Right call at scale with dedicated ops staff. Too much cost and overhead for small teams under 30 servers.
CtrlOps Infra Details: No agent installation needed. Shows live CPU, RAM, disk, and process table per server from inside the app you are already using for SSH and files.
File Management Tools
| Tool | Platform | Price | Needs separate connection |
|---|---|---|---|
| WinSCP | Windows only | Free | Yes |
| Cyberduck | Mac, Windows | Free / $38 | Yes |
| FileZilla | All | Free | Yes |
| CtrlOps File Manager | All | Included | No |
All standalone SFTP tools require opening a second application and re-establishing a connection to a server you are already SSH-ed into. CtrlOps File Manager opens alongside the terminal with no additional connection or credential entry.
When to Use Each Approach
| Situation | Best fit |
|---|---|
| 1 to 3 personal servers, no deployments | Native OpenSSH |
| Mobile SSH access needed | Termius |
| Free, local, open source | Tabby + Netdata + FileZilla |
| 3 to 25 servers, small team, regular deployments | CtrlOps |
| 30+ servers with dedicated infrastructure staff | Enterprise stack |
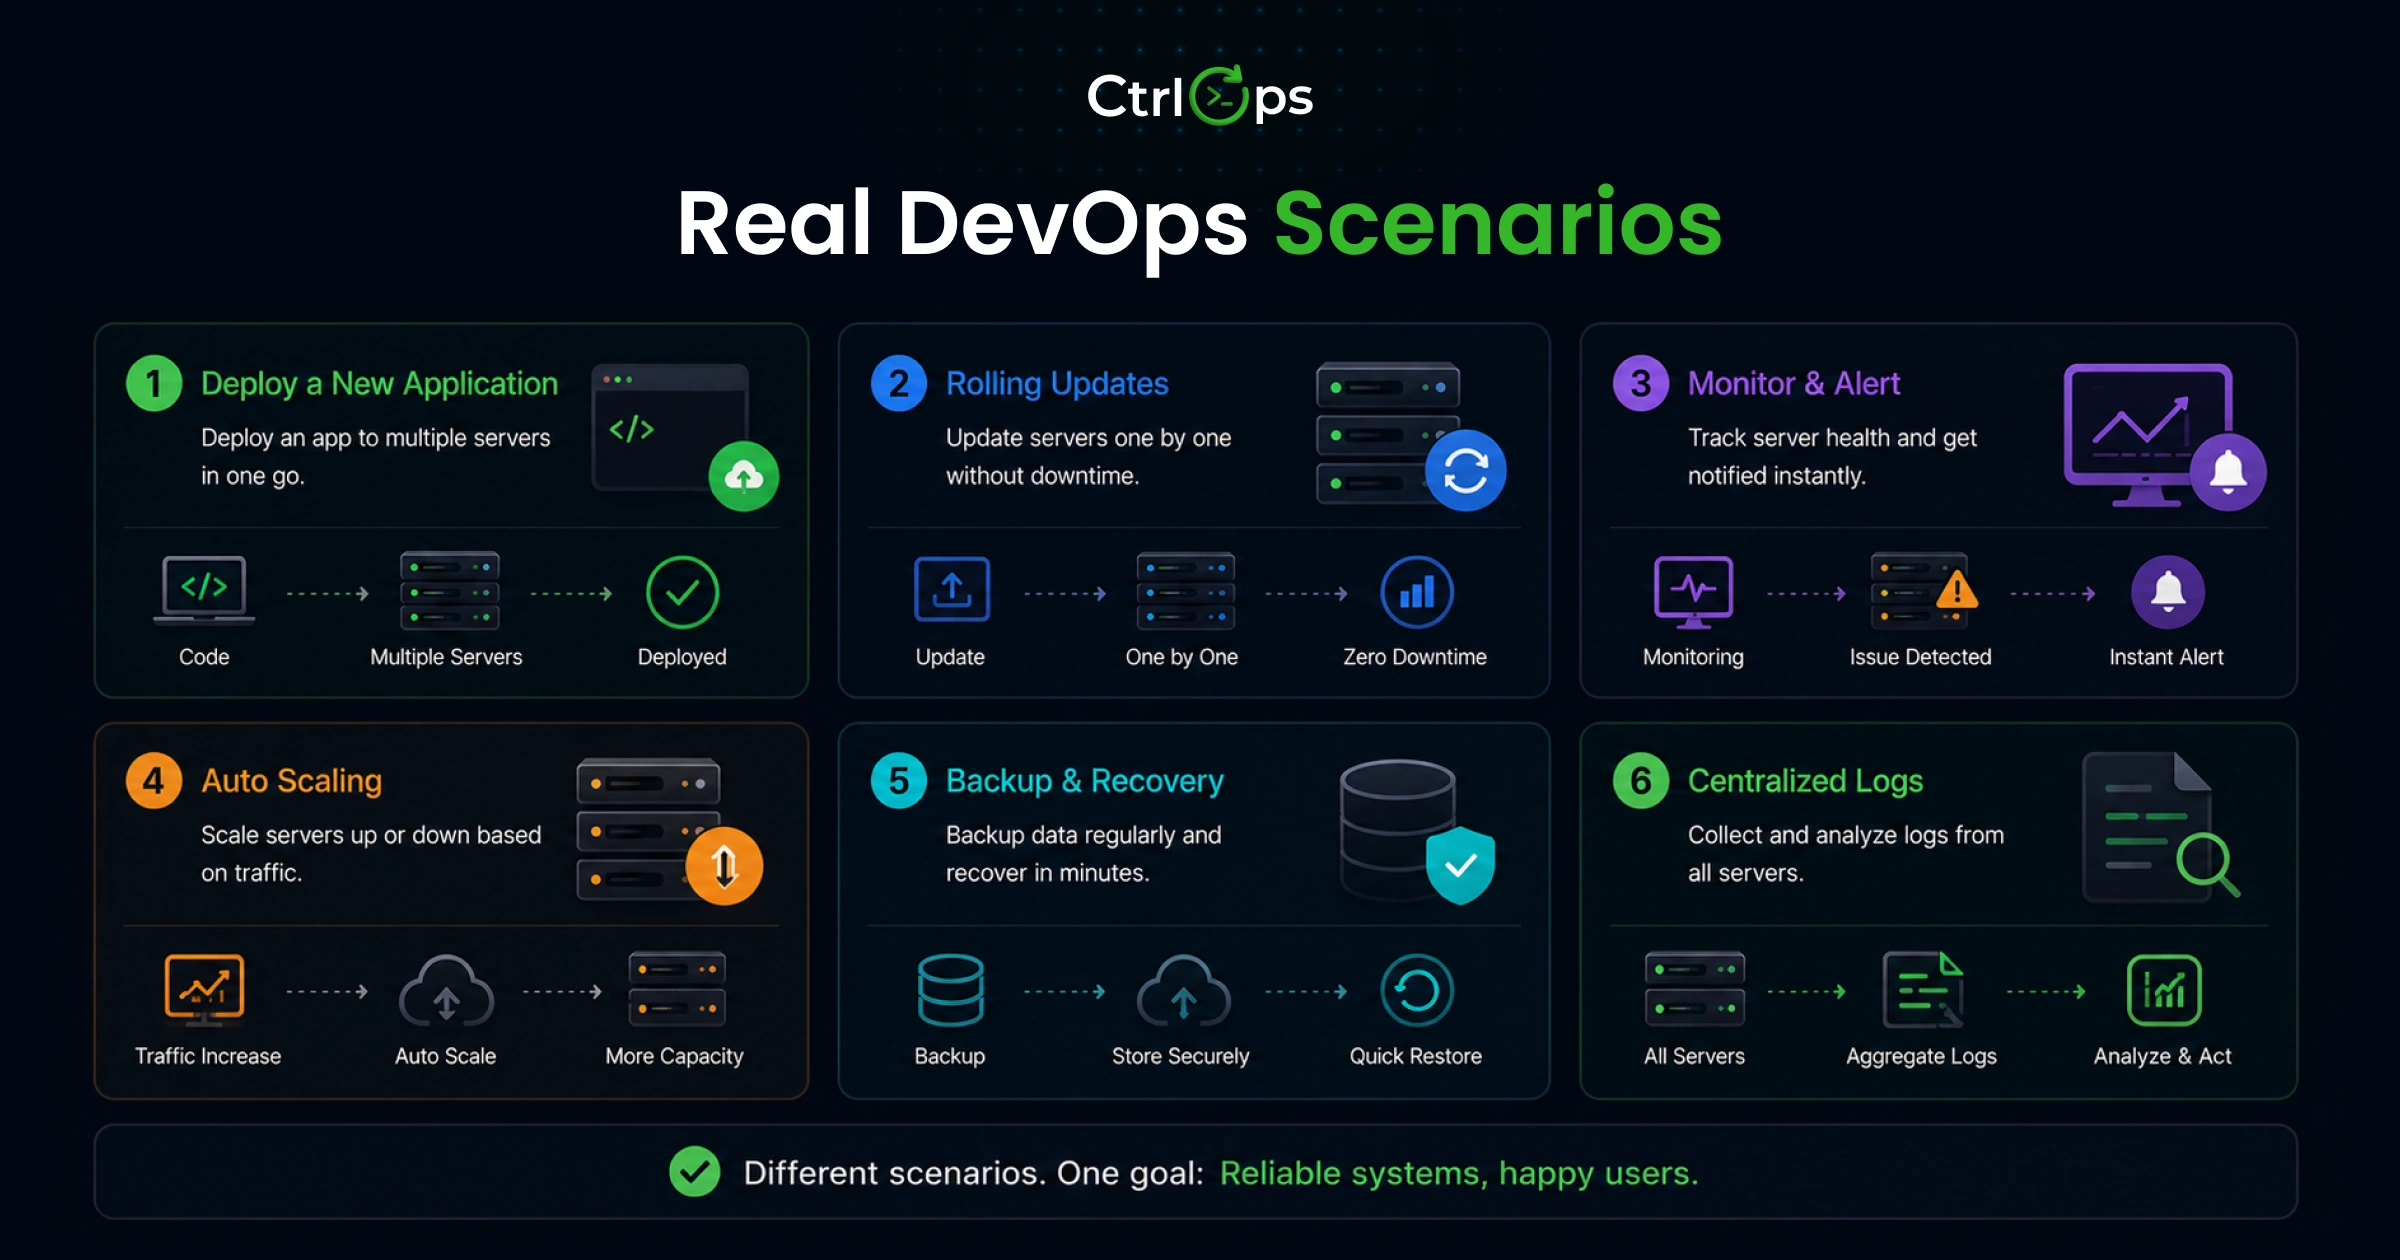
Real DevOps Scenarios: Where Systems Break or Scale
Managing 5 to 20 Servers Simultaneously
The setup: A dev agency managing six clients. Each client has production and staging. Two have separate database servers. Fourteen servers total. Four developers with different access levels.
Where it breaks down:
- Three developers have been updating the server spreadsheet independently. Three versions exist, each slightly different.
- A developer who did not set up Client D's servers needs to connect on a Saturday. They spend 15 minutes finding credentials.
- One developer stored SSH keys in Dropbox "for convenience." A client security audit catches this six months later.
What a working setup looks like:
- All 14 servers added once with consistent naming (acme-prod-web, acme-prod-db, acme-staging-web)
- Any developer can connect in seconds using their own locally stored SSH keys
- New developer onboarding: import configuration file, run SSH wizard, done in under 20 minutes
Deploying Updates Across Multiple Servers
The setup: A startup pushing a hotfix during high traffic. Three servers need the fix: app server, worker server, API server. Same codebase, different configs per server.
Where it breaks down:
- App server: deployed correctly
- Worker server: missed an environment variable that was added manually three weeks ago and never documented
- Worker processes fail silently, with no monitoring on background job failures
- The issue is not caught for 40 minutes until a downstream effect surfaces in user-facing data
- Debugging requires SSH-ing through three servers and checking logs manually
What a working setup looks like:
- Parameterized deployment scripts in a shared script directory
- Scripts pull correct environment-specific values per server automatically
- Infra panel shows all three servers returning a healthy status within seconds
- Any failure surfaces immediately, no manual log check required
Debugging Production Issues at Night
The setup: Production returning 502 errors at 11:30 PM. On-call developer is not the one who built the server setup. Solid developer, limited Linux admin experience.
Where it breaks down:
| Step | Time lost |
|---|---|
| Finding the correct server in the spreadsheet | 5 min |
| SSH-ing in with the right key (wrong key first attempt) | 3 min |
| Running diagnostic commands from an outdated Notion doc | 15 min |
| Identifying disk is full | Finally, after 25 min |
| Clearing disk and restarting the process | 15 min |
| Total incident duration | 90+ min |
What a working setup looks like:
| Step | Time |
|---|---|
| Open CtrlOps, click production server by name | 10 sec |
| Infra Details: disk at 97%, immediately visible | 10 sec |
| AI Terminal: "Node app throwing 502, disk at 97%, what do I do?" | 30 sec |
| Review AI-generated commands, approve each | 2 min |
| Disk cleared, process restarted, 502 errors stopped | Done |
| Total incident duration | Under 15 min |
Which Workflows Fail and Which Hold Up
The pattern is consistent across every scenario:
- Workflows that depend on implicit knowledge (which server is which, which command is current, what "normal" looks like) fail under pressure
- Workflows that externalize that knowledge into systems, naming conventions, parameterized scripts, and visible dashboards hold up when things are hard
The failure is never a lack of skill. It is always a lack of system.
Monitoring Across Multiple Servers
What Metrics Actually Matter
Focus on three things. These catch the majority of server failures before they reach users.
Disk above 85%:
- Almost always heading toward an incident
- Fills from log accumulation, old deploy artifacts, and database growth
- At 100%, most applications fail in ways that are hard to diagnose
- Catching it at 85%: a 5-minute cleanup task
- Catching it at 100%: a recovery operation
Memory pressure above 85% sustained:
- Indicates a memory leak, an under-resourced server, or a rogue process
- Catch it early: restart the process, resize the server, investigate the leak
- Miss it: user-facing slowness that is hard to attribute to a root cause
Sustained CPU spikes:
- Legitimate load increase: you need more capacity
- Rogue process: you need to find and stop it
- You can only tell the difference when you can see the CPU alongside the process table
Alerts vs Manual Checks
| Approach | Posture | When you find out |
|---|---|---|
| No monitoring | Fully reactive | When users report it |
| Manual checks | Partly reactive | When you remember to check |
| Automated alerts | Proactive | Before users are affected |
Setting up alerts requires choosing thresholds, notification channels, and maintaining configuration as your fleet changes. For teams that cannot justify that investment yet, a unified dashboard you actually look at regularly is a meaningful step up from having no visibility at all.
Why Most Teams Miss Early Signals
The answer is friction, not negligence.
If checking disk usage across 10 servers requires 10 SSH sessions and 10 manual commands, most developers will not do it proactively. The effort cost is too high.
If checking disk usage across 10 servers means glancing at a dashboard already open in the same app you use for SSH, developers do it regularly because the cost is nearly zero.
A monitoring system that requires effort to access is a monitoring system that will not be used proactively. And a monitoring system nobody uses proactively provides no better early warning than no monitoring at all.
The simplest monitoring habit that prevents most incidents: a 10-minute fleet health review every Monday morning. Open your server management tool, scan disk and memory across all servers, and note anything trending toward a threshold. Ten minutes per week. The incidents it prevents cost hours.
What Actually Works for Server Management at Any Scale
Best Approach for Solo Developers
- Set up a proper
~/.ssh/configwith named hosts for every server you manage - Use dedicated server management software for developers with named connections, not raw terminal tabs
- Write parameterized deployment scripts and store them somewhere findable under pressure
- If you consistently open more than two tools for a typical server management task, evaluate whether a unified tool recovers enough time to be worth it
Best Approach for Startup Teams
The most urgent risk for a startup team: the knowledge bus factor. One developer is the only person who knows which server is which and what to do when things break.
Address this before the crisis, because the crisis will be the worst possible time to discover the knowledge that lives in one person's head:
- Use tooling that makes server access shareable through a configuration file, not shared credentials - the right server management software for developers pays for itself the first time you onboard a new engineer in 20 minutes instead of half a day
- Standardize deployments so every team member follows the same steps to the same outcome
- Add basic monitoring before the first major incident, not in response to it
Managing 5+ Client Servers as a Freelance Developer
Freelancers face a version of the multi-server problem that is distinct from teams, and almost entirely unaddressed by standard tooling.
The core tension: you need to manage client servers as a freelancer with the operational discipline of a team, while working as a single person, without the time to build and maintain a multi-tool stack.
What makes the freelance scenario different:
- Each client has separate SSH keys, separate credentials, and separate deployment processes
- Context switching between clients is not just between servers - it is between entirely different environments and expectations
- You are the bus factor. There is no second person who knows which server is which
- Billing time spent searching for credentials or context-switching between tools directly reduces the hourly rate
The specific failure modes that hit freelancers:
- The client spreadsheet has four versions across three projects and Notion
- SSH keys stored in Dropbox or a shared folder for "convenience" - a security risk that surfaces only when a client asks who has access (the SSH key storage best practices guide covers the safe alternatives)
- Deployments look different client to client because each was set up differently, six months apart
- A client calls on a Saturday. You spend 12 minutes finding the right credentials before you can even SSH in
What a clean freelance server management setup looks like:
The naming convention matters more here than anywhere. Because clients are the organizing unit, not environments:
clienta-prod-webclienta-staging-webclientb-prod-apiclientc-prod-web
Each client's servers are immediately identifiable. Zero IP lookups required.
With CtrlOps, a freelancer adds each server once, using the client-based naming convention. Every subsequent connection is one click from the Multi-Server Directory. SSH keys stay local, per-client, never shared. When a client relationship ends: remove their servers from the directory, done.
The economics are direct. If you manage client servers as a freelancer and bill at $75/hour:
- 15 minutes recovered per deployment × 3 deployments/week = 45 minutes/week
- 45 minutes × 52 weeks = 39 hours/year recovered
- At $75/hour: $2,925 in billable time recovered annually from a $7/month tool
The tool cost is roughly 3% of what it recovers.
The freelancer test: Can any client server you manage be accessed within 30 seconds from a cold start - no spreadsheet lookup, no credential hunting, no terminal tab archaeology? If not, the cost is not just productivity. It is the professional impression you make at 11 PM when a client's site is down, and they are watching how fast you respond.
Best Approach for Scaling Environments
At 25+ servers or 8+ developers, the math shifts:
- Dedicated monitoring infrastructure (Datadog, Prometheus + Grafana) becomes a justified investment
- Proper CI/CD pipelines pay back their setup cost clearly
- Specialized tooling for each function makes sense when you have staff to maintain it
For the period between "a handful of servers" and "need enterprise infrastructure," a unified desktop tool covers the gap without requiring you to build and maintain a multi-tool stack.
Simplest Setup That Still Scales
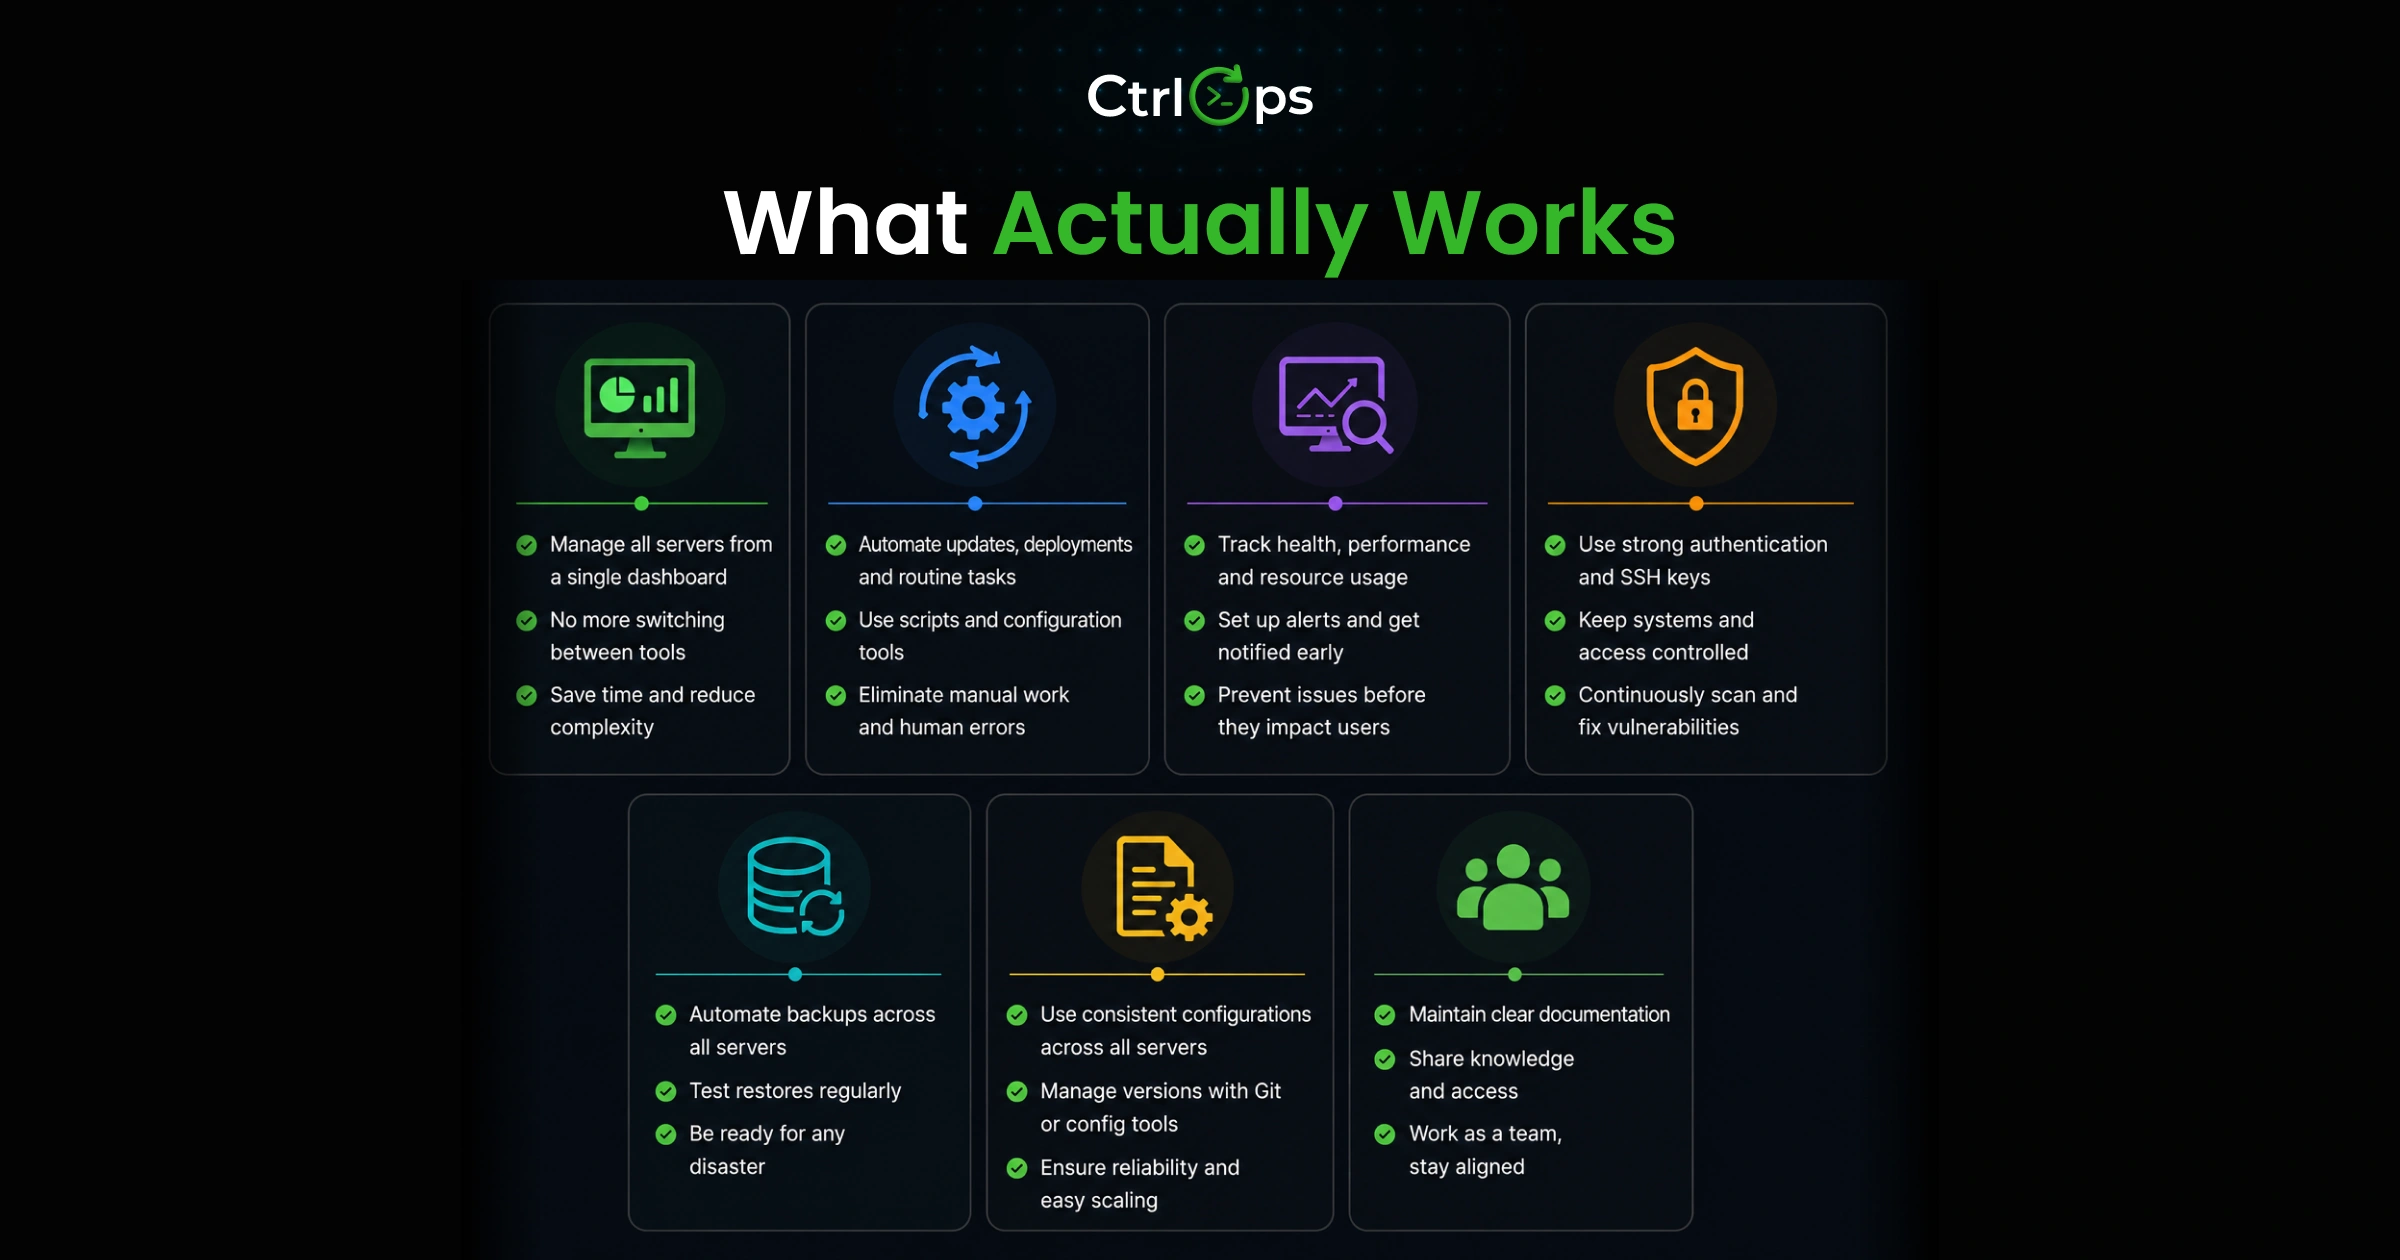
These four things together cover most teams up to 25 servers and 10 developers:
- Named servers in a management tool with one-click connect
- Integrated file management alongside the terminal
- A visible monitoring panel is checked regularly
- Parameterized deployment scripts run the same way every time
Not the most sophisticated setup possible. The one that actually gets used consistently because the friction is low enough that people do not bypass it under pressure.
Common Mistakes When Managing Multiple Servers
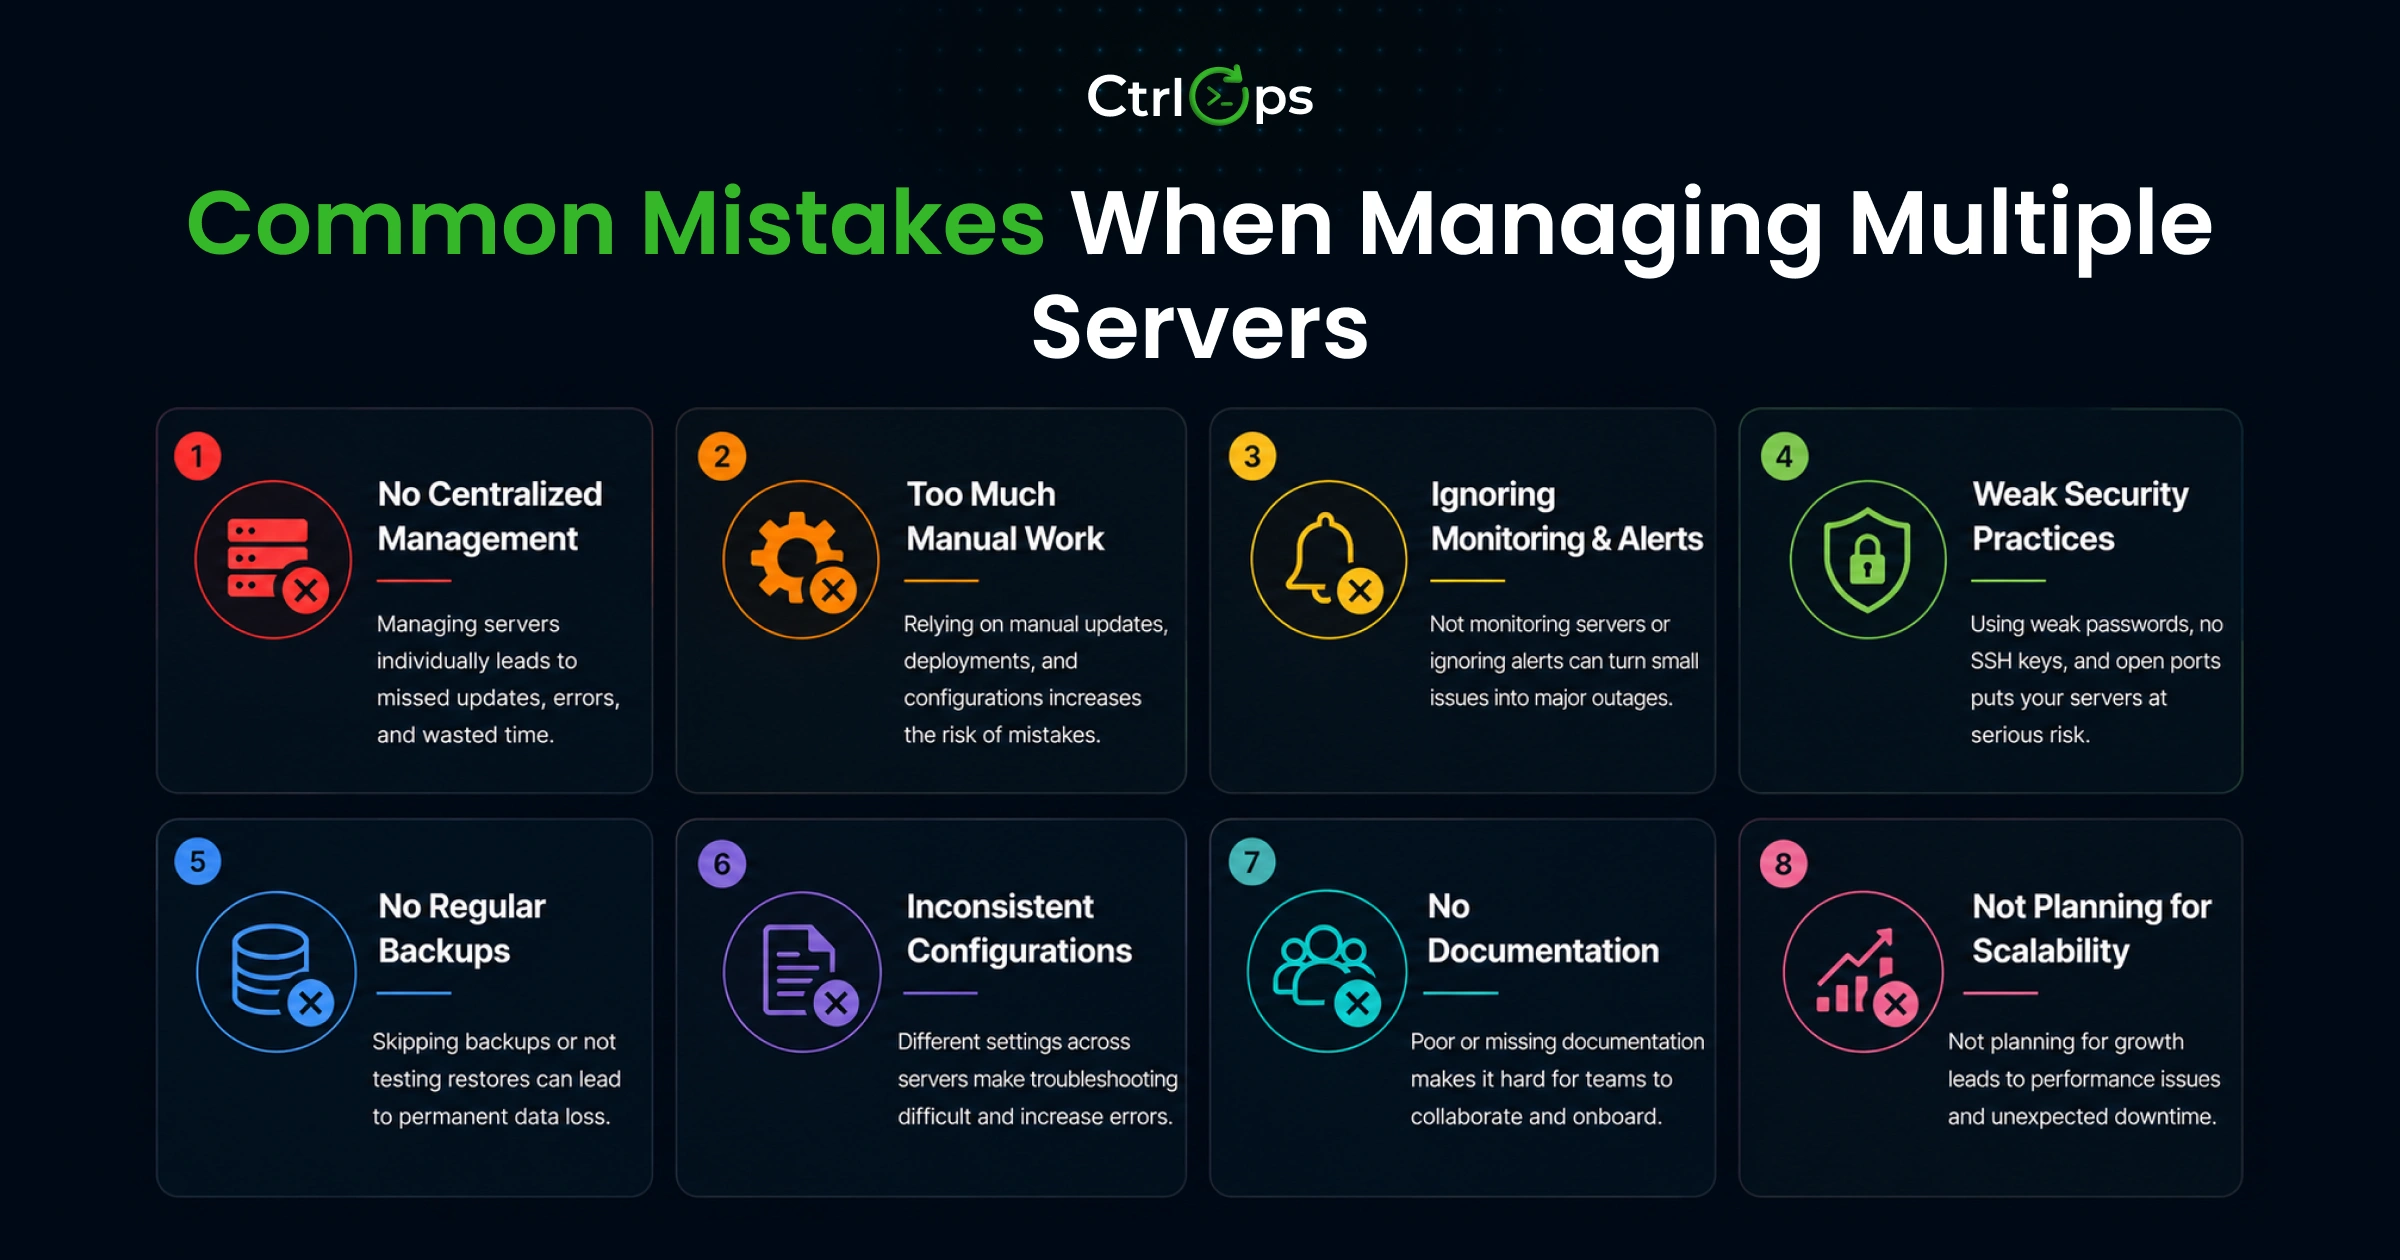
Relying on Memory Instead of Systems
Storing critical infrastructure information in your head: which IP maps to which server, which key goes with which client, which deployment command is current - and it works until it does not.
The failure always happens under pressure: when you are tired, distracted, or moving fast.
What to externalize instead:
- Server names and connection details (not IPs)
- Deployment steps, written and version-controlled
- Environment variable differences between servers, documented
- Runbooks that any developer on the team can follow
The investment is for a few hours. The return is eliminating an entire class of incidents for as long as you use the system.
Using Too Many Disconnected Server Management Tools
Every additional tool in your server management workflow is:
- A context switch with a cognitive cost
- A separate set of credentials to maintain when servers change
- Another configuration that drifts out of sync over time
- Another interface that a new team member has to learn
Evaluate tool consolidation based on the total workflow cost, not on whether each individual tool is excellent at its specific job. A tool that handles four jobs at 85% of the capability of four specialized tools is often the better operational choice when the alternative is four context switches per task.
No Standardized Deployment Process
"Everyone has their own way of deploying" is a description of a system waiting to fail.
Consequences:
- Incidents are harder to diagnose: was it the code change or how the deployment was executed?
- Senior developers become bottlenecks: they are the only ones who know the full correct process
- Production drifts from staging in ways that create "only reproduces in production" bugs
The fix: standardize the process once, write it down, and use tooling that enforces the standard rather than depending on each developer to remember every step every time.
Bottom line: The teams that handle scale well do not have better memories or more discipline. They have systems that prevent these failures by design. Names instead of IPs. Scripts instead of rituals. Dashboards instead of gut checks.
Final System: How to Set Up a Clean Multi-Server Workflow
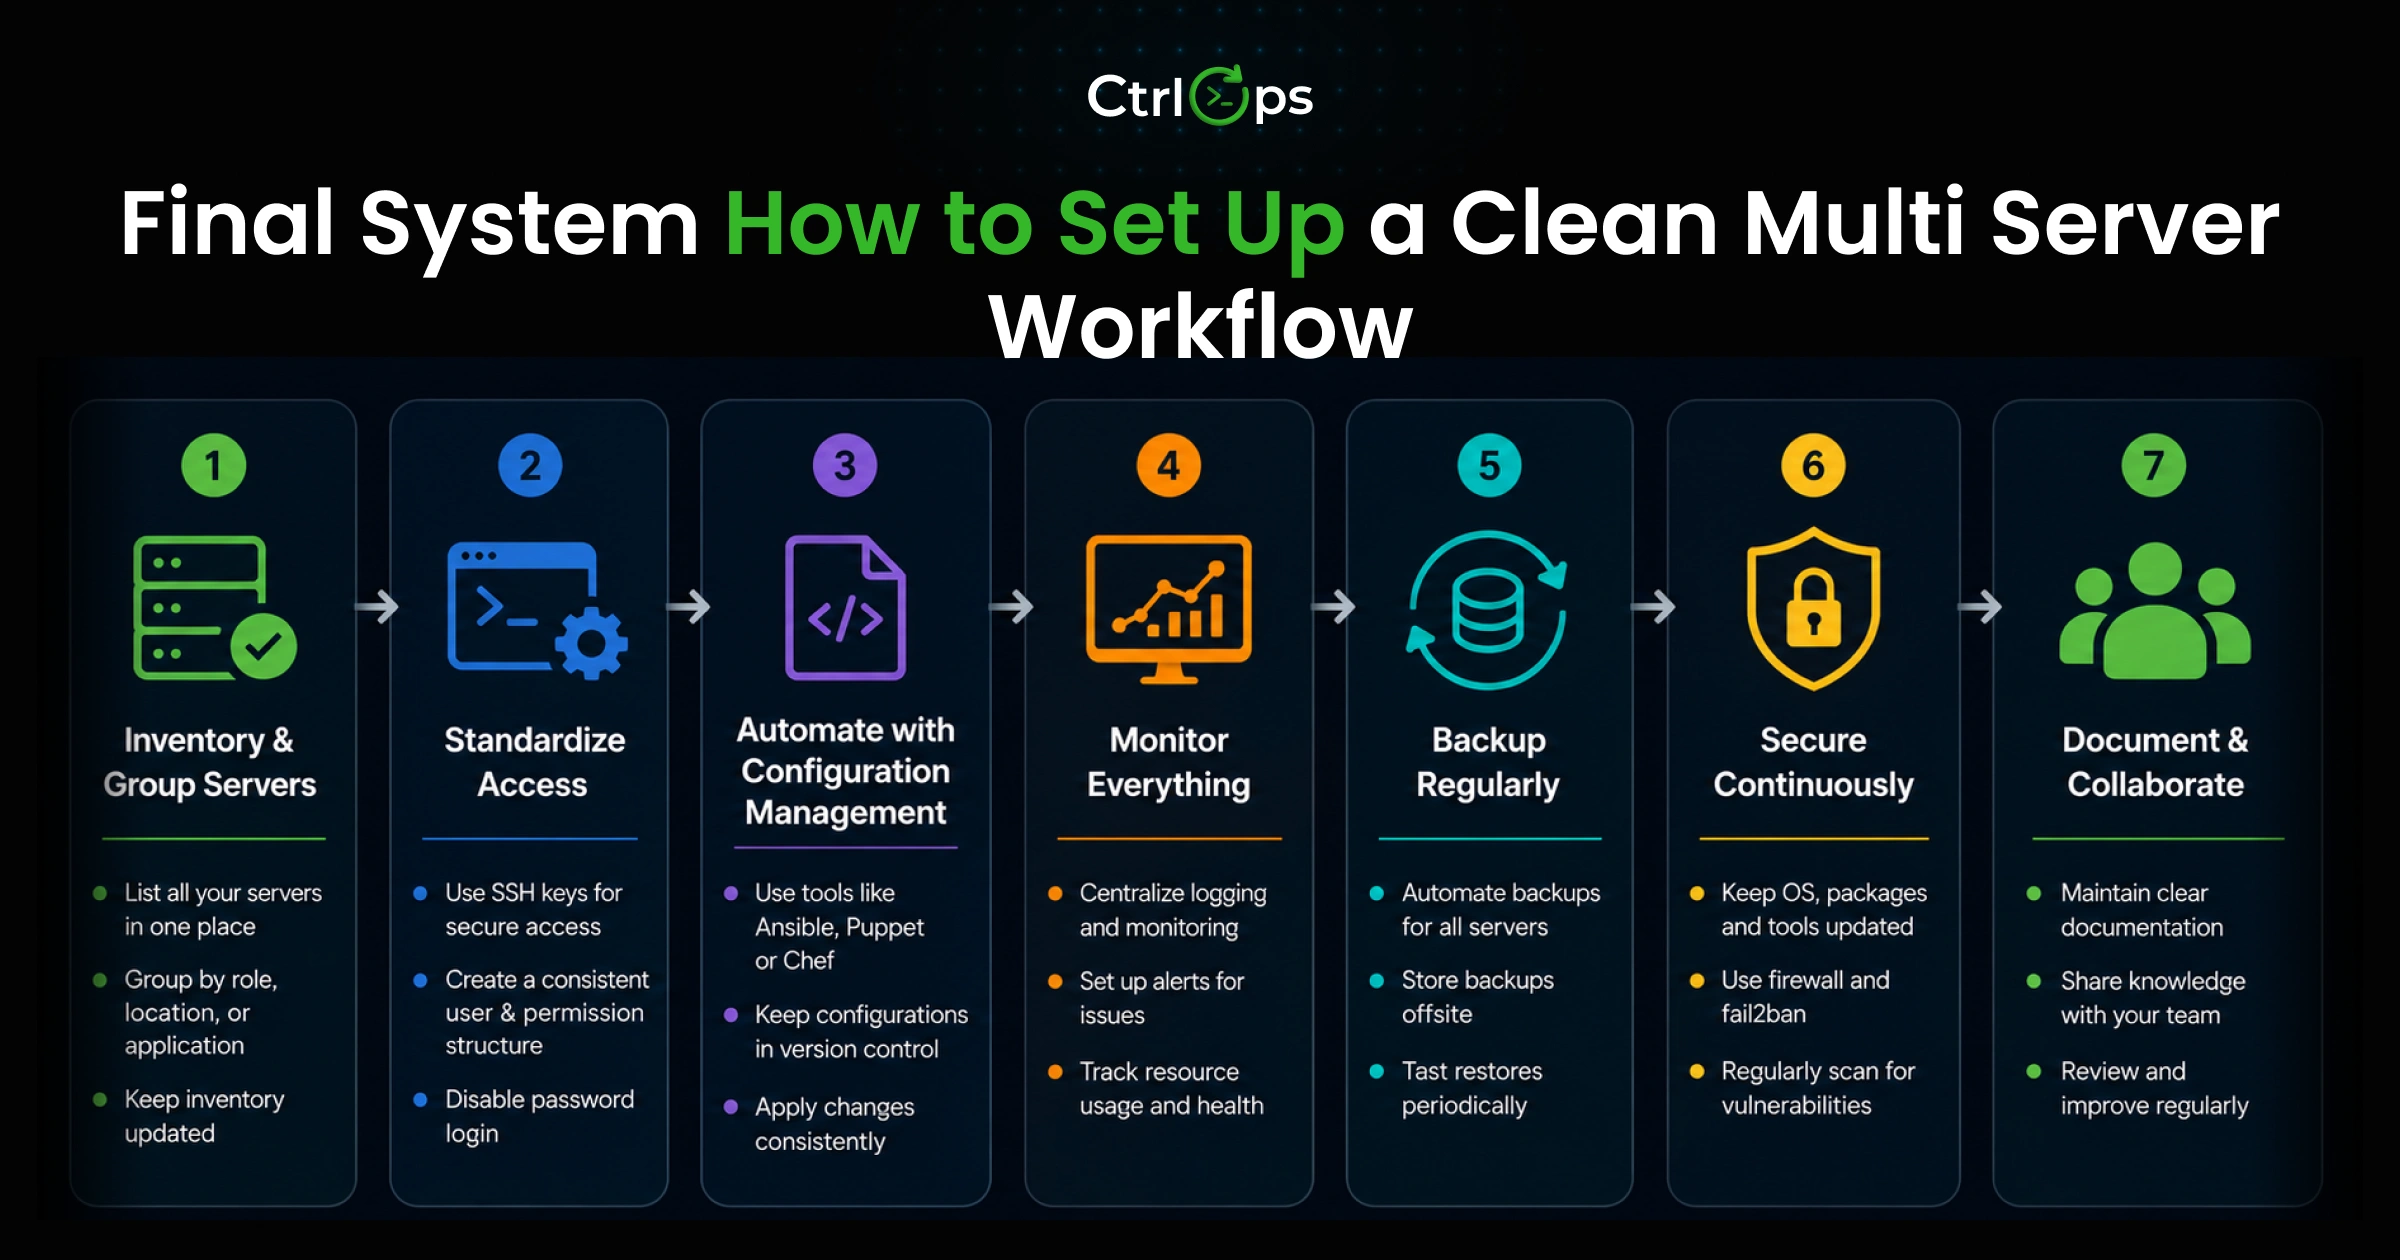
This is the practical setup that works for most developers and small teams managing 5 to 25 servers.
Step 1: Name Every Server Before You Add It
Establish a naming convention and apply it immediately.
A reliable pattern: [project-or-client]-[environment]-[role]
Examples:
acme-prod-webacme-prod-dbacme-staging-webinternal-prod-apiclientb-prod-worker
This naming convention tells you what you are looking at, what environment it belongs to, and what role it plays, before you connect to it.
Retroactively renaming and reorganizing fifteen servers later is painful work. Name them correctly from the start.
Step 2: Centralize All Server Connections in One Place
Add every server to a single connection manager using the naming convention from Step 1.
In CtrlOps, this is the Multi-Server Directory: add a server once (name, IP, username, SSH key or .pem path), and it is available with one click for any team member who imports the configuration file.
Whether you use an SSH config file or a dedicated tool, the goal is the same: connect to any server without looking up an IP address.
Step 3: Stop Using a Separate SFTP App
If your current SSH client does not include a file manager, evaluate what switching to one that does would cost versus what it would recover.
The test: next time you need to edit a config file on a server you are already SSH-ed into, count the steps. If the answer involves opening a second application and re-entering credentials, that workflow has more friction than it needs.
Step 4: Add Basic Monitoring Without Extra Infrastructure
Connect through a tool that shows you CPU, RAM, and disk across your fleet without requiring agents installed on each server.
Check it at least once a week. Build the habit before you need it.
Step 5: Parameterize and Standardize Your Deployments
For each application type you deploy regularly:
- Write a script with variable placeholders for the values that differ between servers
- Store it where any team member can find it under pressure
- Test on staging before production
- Run from the same tool every time
Set up your full server management system for any new server before you deploy anything to it. Add it to the directory with the correct name. Check its initial monitoring metrics. Run a test script. This 15-minute setup investment prevents rebuilding server knowledge under incident pressure months later.
Conclusion: Systems Beat Memory
Managing multiple servers is not the hard part. Managing them without a system is where the problems start.
Name your servers. Centralize your connections. Stop switching between four tools to complete one deployment. Write your deployment process down and run it the same way every time.
These are not complicated technical changes. They are system-level decisions. And system-level decisions compound - in your favor - once you make them.