Linux Server Monitor: Real-Time Infrastructure Dashboard
Live CPU, memory and disk on every server - color-coded gauges that turn red before things break. No top, no htop, no SSH window juggling.
How Real-Time Monitoring Works
Step 01 - You
Connect.
Point CtrlOps at any server you can SSH into. No agent to install, no daemon to run - metrics start streaming in seconds.
Step 02 - CtrlOps
Watch.
CPU, memory and disk gauges refresh every 2 seconds and recolor green to red. The top 10 processes sort themselves by whatever is eating the box.
Step 03 - You
Act.
One click frees cached memory or clears old logs and temp files. Spot a runaway PID? Hand it to the AI Terminal to kill.
You were flying blind between top and df -h.
Checking a server meant SSH-ing in and running the same five commands from memory, one box at a time - then keeping a wall of terminal tabs open and forgetting which was which. You noticed the spike after it caused the outage.
The spike turns the gauge red before it turns into downtime.
Watch it, go live.
This is the real Infra Details tab running on demo data. Sort the processes, catch a CPU spike, free the cache, clean the disk - the gauges react exactly like they do on a live server.
The moments this actually saves you.
Not a feature list. The situations where the answer is one SSH session and five remembered commands away, and what changes in each one.
You noticed the spike after it had already caused the outage.
See the gauge go red before it turns into downtime
Every gauge recolours as usage climbs - green to about 60, yellow to 80, orange to 90, red above that. A resource on its way to becoming a bottleneck looks different from a healthy one, at a glance, without you reading a number.
- Colour-coded thresholds
- CPU, memory and disk together
- Refreshes every two seconds
Something is eating the CPU and you are recalling a ps aux pipeline.
Sort the table, get the PID, hand it to the terminal
The ten heaviest processes are already listed. Click CPU or Memory to sort and the runaway jumps to the top with its PID next to it. Take that PID to the AI Terminal, which writes the kill command and waits for your approval.
- Top ten, live
- Sort by CPU or memory
- Nothing killed without your click
A separate panel, on a separate dashboard, per server.
One screen instead of one dashboard per box
Every server you have saved reports the same three gauges in the same place, so moving between them is a click rather than a login. Nothing is installed on any of them to make that work.
- Every server, one screen
- No panel on the host
- Works on boxes you set up years ago
The disk is climbing and the fix is a hand-written find and rm.
Reclaim the disk in one click, not one pipeline
Clean Disk Space clears logs older than two days, compressed archives, journal entries older than three, temp files and package caches. The gauge drops as soon as it finishes. Clear Buffer/Cache does the same for the RAM Linux was holding.
- One click, no sudo incantation
- Logs, journal, temp and caches
- The gauge answers immediately
More than pretty gauges.
Thresholds that warn you early, a process table that names the culprit, and two buttons that fix the two things that actually go wrong.
Red before it breaks
Every gauge recolors as usage climbs - green, yellow, orange, red. You see the bottleneck forming instead of reading about it in a downtime report.
Name the culprit
The 10 heaviest processes, live. Click CPU% or Memory% to sort and the runaway jumps to the top - no ps aux pipeline to recall.
Free the cache
One click releases the RAM Linux was holding for file reads. No root incantation, no sudo tutorial.
Reclaim the disk
Old logs, compressed archives, journal entries and temp files - swept in one click instead of a hand-written find and rm.
Hand the PID to the AI
Spot the runaway here, kill it in the AI Terminal - in plain English, with the command shown before it runs.
Server health, at a glance.
What people running real production boxes say once every server's CPU, memory and disk sits on one screen.

Each server has its own separate monitoring tool for things like CPU status and RAM status. This setup allows me to quickly navigate from one server to another.
The infrastructure details and automated backups provided by CtrlOps are super useful. I appreciate that I don't have to manage separate panels for each server.

Been exploring the product recently, and it already includes: • AI-assisted terminal with command approval • Real-time server monitoring • SSH management • Remote file manager • Backups & automation scripts • Multi-server management • One-click GitHub deployments Everything works directly over SSH, and credentials stay local 🔐
The AI Terminal with an Approval Gate: being able to ask for a fix in plain English is great, but the fact that it shows you the command and asks for approval before running it on live infrastructure is a massive safety net.

The AI-assisted debug loop for Linux servers is something we've wanted at RetainSure for a while. Chasing down intermittent issues across multiple EC2 instances usually means a lot of context switching between logs, metrics, and SSH sessions.
I can get all the data from different Linux-based servers in one place with all the details, instead of reviewing individual dashboards.
I use CtrlOps to manage multiple servers with ease. Its GUI-based file manager saves me a lot of time, and the AI terminal helps me troubleshoot server issues quickly.
No agent. No cloud.
CtrlOps reads your server the way you would - over your own SSH connection, every 2 seconds. There is nothing to install on the box and nothing in the middle to breach.
Nothing installed on the server
No agent, no daemon, no exporter, no cron job. CtrlOps runs the same read-only commands over SSH that you would type yourself - so a server you set up years ago works today.
Metrics stay on your machine
Readings go straight from your server to your desktop app and are drawn on screen. Nothing is shipped to a CtrlOps cloud, and your SSH keys stay AES-256 encrypted on your device.
Not a Prometheus replacement
No alerting on this dashboard (for that, use a Cron Jobs alert template), no year-long history, no fleet of a thousand hosts. This is the live health check for the handful of servers a solo dev or a small team actually runs.
More you can do with CtrlOps.
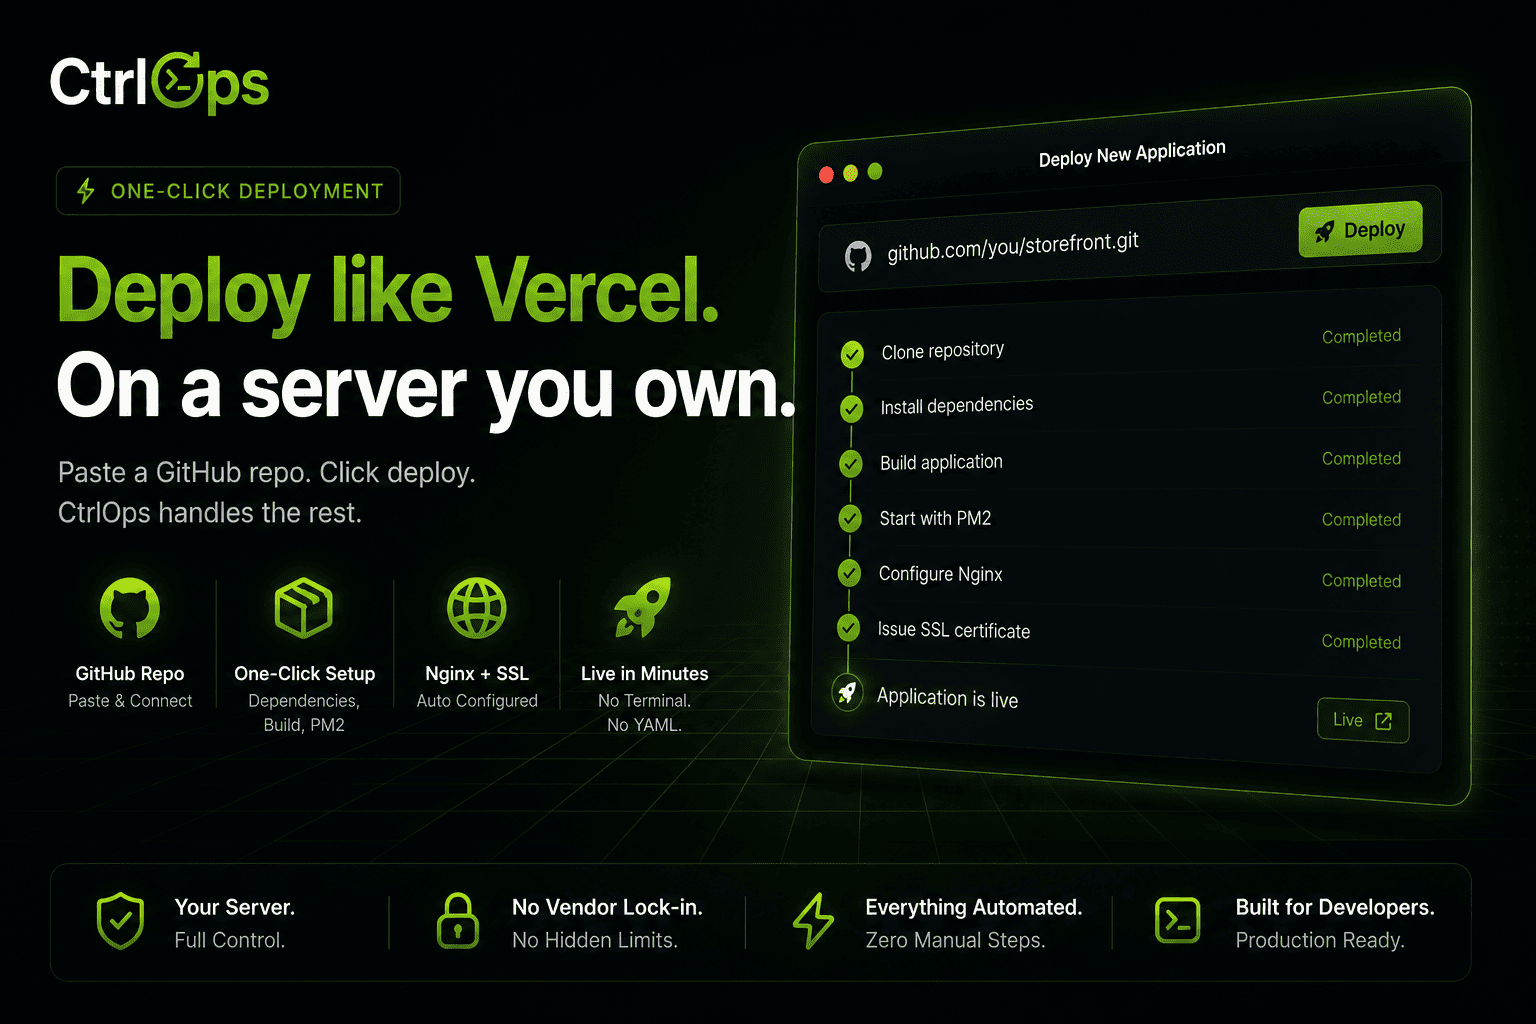
Single-Click Deployment
No scripts, no CI/CD setup. Fill one form and it goes live with PM2, Nginx, and SSL handled for you.
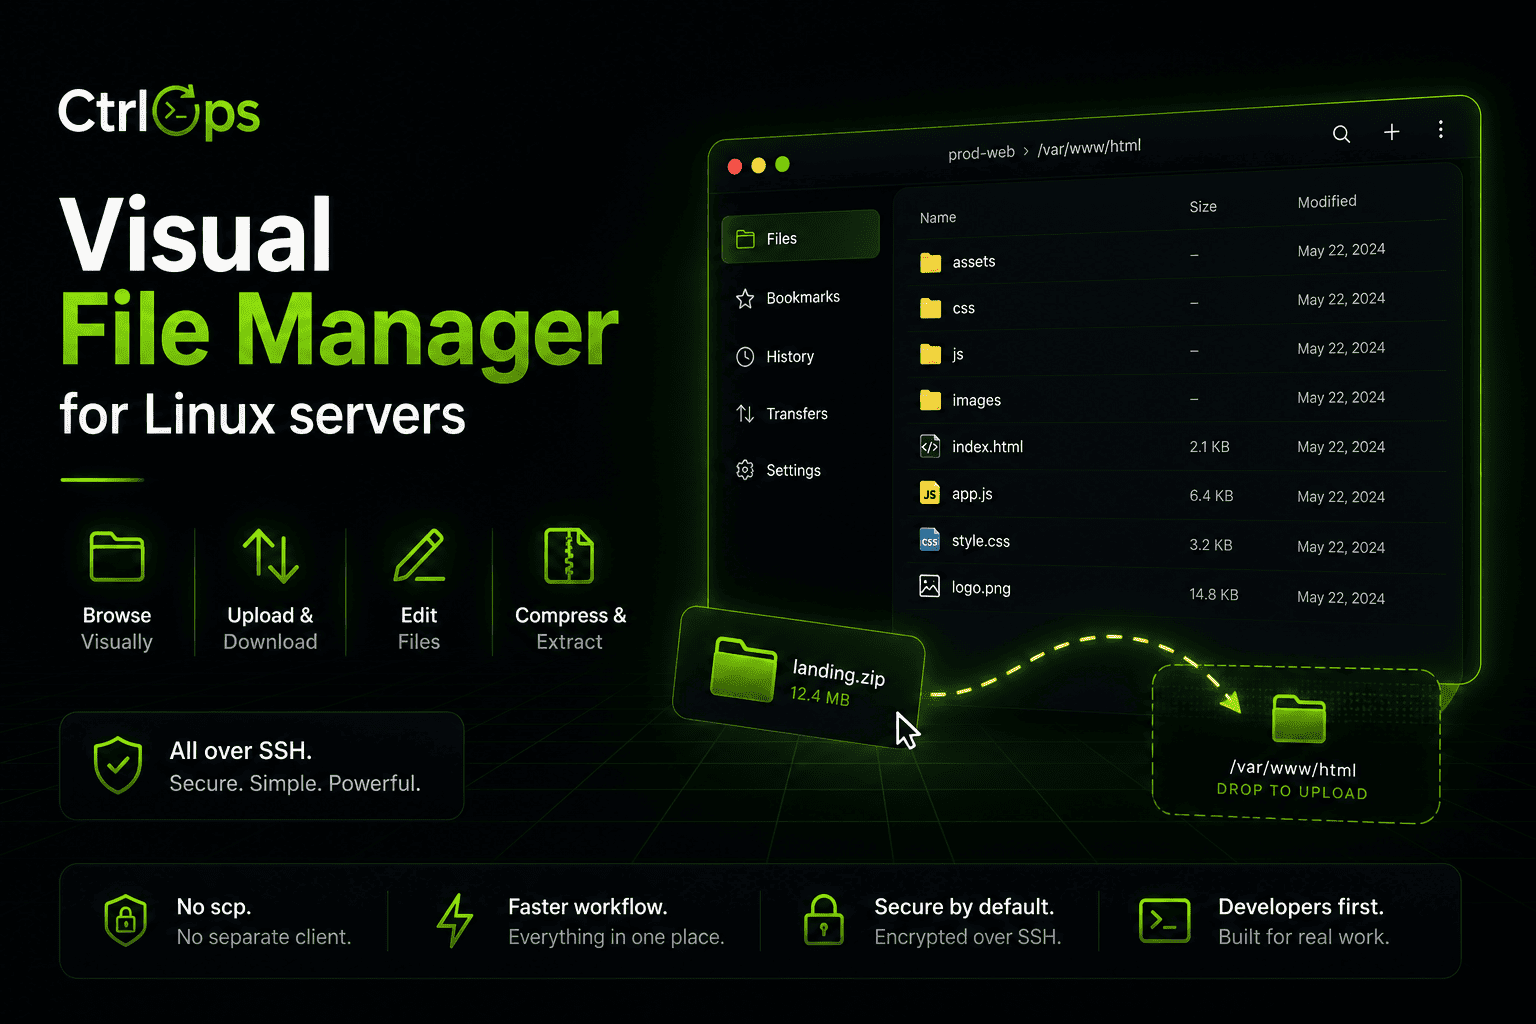
Visual File Management
Browse, upload, download, and unzip remote files in one click. No more scp gymnastics.
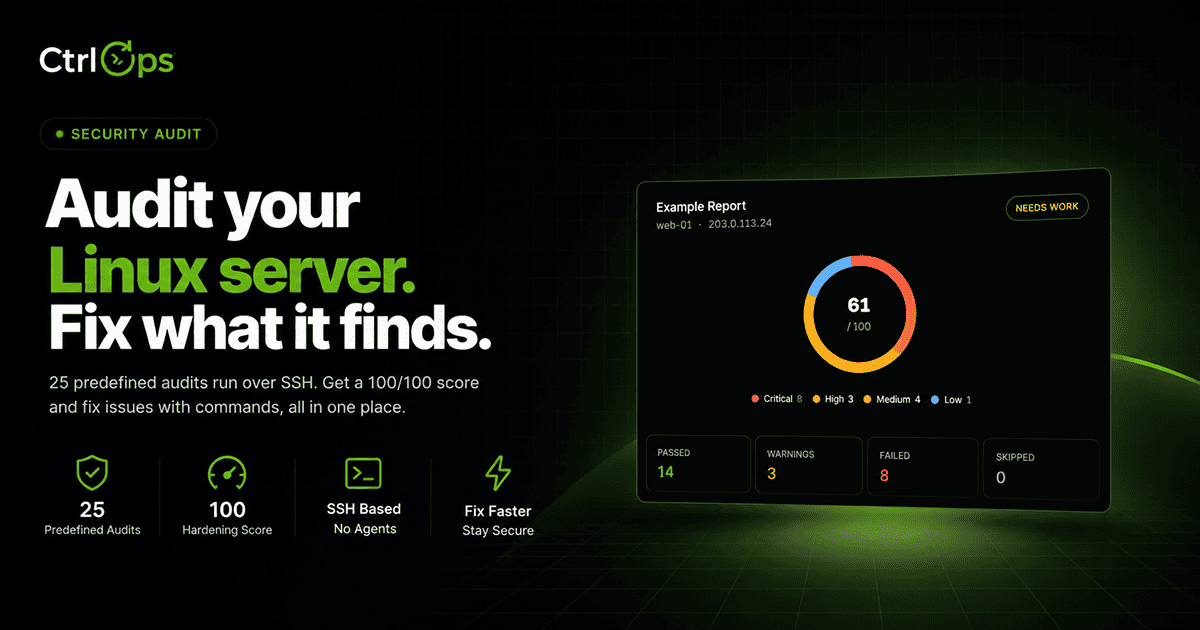
Security Audit
Run 25 security audits over SSH for a hardening score and a PDF report, then fix findings with approval-gated AI.
Questions before you point it at prod.
Stop SSH-ing to check. Just glance.
Live CPU, memory and disk on every Linux server - color-coded before things break, with nothing installed on the box. 1-month free trial, no credit card.
✓ Start instantly·✓ No credit card·✓ No sneaky autorenewals