Every PM2 process. Managed by clicking.
In pm2 list, a process that has restarted 120 times looks exactly like a healthy one. CtrlOps makes it obvious, shows you why, and restarts, reloads or stops it in one click.
How it works
Step 01 - CtrlOps
Lists.
Open the PM2 tab and every process the daemon is keeping alive is there, with live CPU, memory and restart counts.
Step 02 - It
Shows.
Open one and you get event loop lag, heap usage and the auto-restart rules it is running under - plus its logs, live.
Step 03 - You
Act.
Restart, reload without dropping requests, stop, or delete. One click each, no command to remember.
Did the restart work? Run pm2 list again to find out.
A terminal answers one question at a time and never volunteers the next one. What is running, what is wrong with it, why - then you re-run the command you started with, because that is the only way to see whether the fix took.
This is the PM2 tab. Nothing here is a video.
A working replica of the panel, with the same guards the real one has. Start where a fresh server starts: with no pm2 binary at all.
PM2 is not installed
No pm2 binary was found on this server. Install it globally to manage processes from here.
PM2 needs Node.js on the server. This one has v22.
There is no Create Process button here because the tab does not have one - it manages what PM2 already knows about. There are no alerts and no metric history either, for the same reason.
Every one of these except the first says online. Only one of them is actually fine.
Normal. Deploys and the odd blip.
Worth a look. Something is knocking it over.
Crash-looping. PM2 is papering over a real bug.
Online is not the same as healthy.
PM2 does its job so well that it hides the problem. A process crashes, PM2 brings it back, and the status column says online again within a second. Do that thirty times an hour and the status column still says online.
The restart count is the only place that shows up, and in pm2 list it is one more column of digits in a monospace table. Here it is colour-coded, so a three-digit history is the loudest thing on the screen instead of the quietest.
That is the whole trick: sort your attention by restarts, not by status. A process that has come back 120 times is where your bug is, whatever colour its dot is right now.
The moments this actually saves you.
Not a feature list. The situations where a process looks fine, is not, and the terminal will only tell you one thing at a time.
It says online, so you assume it is fine.
Sort your attention by restart count, not by status
PM2 does its job so well that it hides the problem. A process crashes, PM2 brings it straight back, and the status reads online again within a second. Do that thirty times an hour and it still reads online. The restart column is where that shows.
- Restart counts, colour-coded
- Under 10 normal, 100+ crash-looping
- Live CPU and memory per process
pm2 logs, scroll, and hope the reason is still on screen.
Open the process and read the last lines before it died
Click the process, switch to its Logs tab, and its output streams into the panel filtered to that one app. The reason is almost always right there - a missing environment variable, a port already in use, or a database it cannot reach.
- This app, not the whole box
- Streams live as it writes
- Event loop lag and heap alongside
One worker is leaking, so you reload all four.
Restart the instance that is misbehaving and leave the rest serving
A clustered app is one row with its combined CPU and memory. Expand it and every instance has its own id, memory and restart count, so you can restart the one that is leaking. Reload replaces workers one at a time, which is only truly zero-downtime in cluster mode.
- Expand to per-instance
- Restart one, not the cluster
- Reload without dropping requests
Did the restart work? Run pm2 list again to find out.
The row updates itself, so there is nothing to re-run
A terminal answers one question at a time and never volunteers the next one - which is why the last command in every PM2 session is the same as the first. Here the row you acted on updates in front of you.
- Restart, reload, stop, delete
- One click each
- The row answers on its own
The numbers pm2 list never showed you.
Live metrics per process, the runtime internals underneath them, and the controls that act on what you find - plus the two caveats worth knowing before you click.
The metric that predicts slow
CPU and memory tell you a process is busy. Event loop lag tells you it has stopped answering. A healthy Node process sits under a millisecond; once lag climbs into the hundreds, requests are queueing behind synchronous work even though CPU looks fine.
One worker, not the whole cluster
A clustered app is one row with its combined CPU and memory. Expand it and every instance has its own id, memory and restart count - so when one worker is leaking, you restart that one and leave the other three serving.
This app's output, not the whole box
Open a process and its output streams into the panel, filtered to that one app. For whole log files with history, the Logs tab is still where you go.
What PM2 will do without you
Max memory restart, watch and reload, autorestart, and the last exit code, per process. Worth knowing: reload is only zero-downtime in cluster mode - on a fork process there is one worker, so it behaves like a restart.
No pm2 on the box yet?
The tab says so and offers to install it globally, so a fresh server goes from nothing to a managed process list without you opening a shell. Node.js needs to be there first.
A control panel, not a monitoring platform.
This is the honest version of the boundary. The PM2 tab is where you act on processes - see what is wrong and fix it while you are sitting there. It is not where you find out that something broke overnight, and it never claims to be.
What it does
- Lists every process PM2 is managing, with live CPU, memory and restart counts.
- Restarts, reloads, starts, stops and deletes them - one click each.
- Shows event loop lag, heap usage and Node.js runtime internals per process.
- Streams a single process's logs live, filtered as they arrive.
- Expands a cluster so you can act on a single instance.
- Installs PM2 on a server that does not have it.
What it does not
- No alertingNothing pages you, emails you or posts to Slack when a process dies. The tab shows you what is happening while you are looking at it. If you need to know at 3am, use PM2 Plus, Datadog, or Prometheus with Alertmanager.
- No metric historyThe cards and sparklines are live only. Nothing is retained, so there is no last Tuesday to compare against and no trend over a week. That is an APM's job. This replaces pm2 monit, not your monitoring stack.
- No process authoringYou cannot create a process or edit ecosystem.config.js from the tab. It manages what PM2 already knows about. Apps shipped through CtrlOps deployments register themselves; anything else you start once, then manage here.
It runs over the SSH connection you already have, so nothing is installed on the server beyond PM2 itself and nothing about your processes leaves your machine. See how CtrlOps handles SSH, or the PM2 documentation for every control in detail.
More you can do with CtrlOps.
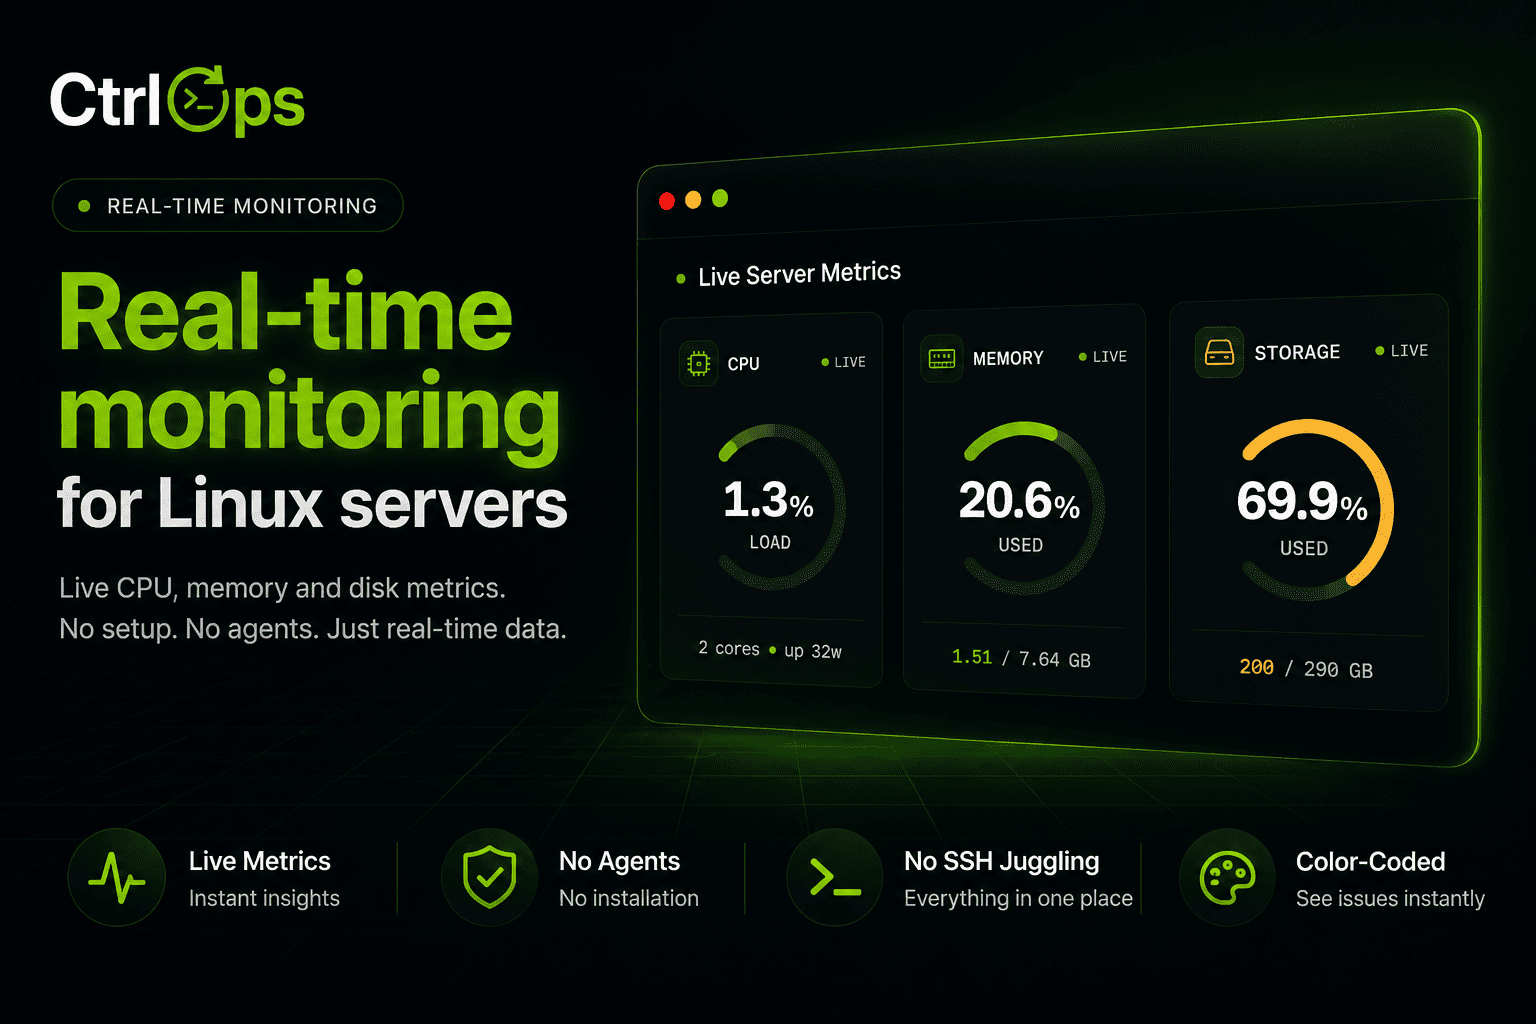
Real-Time Infra Monitoring
Live CPU, memory, disk, and network for every server, streamed as it happens.
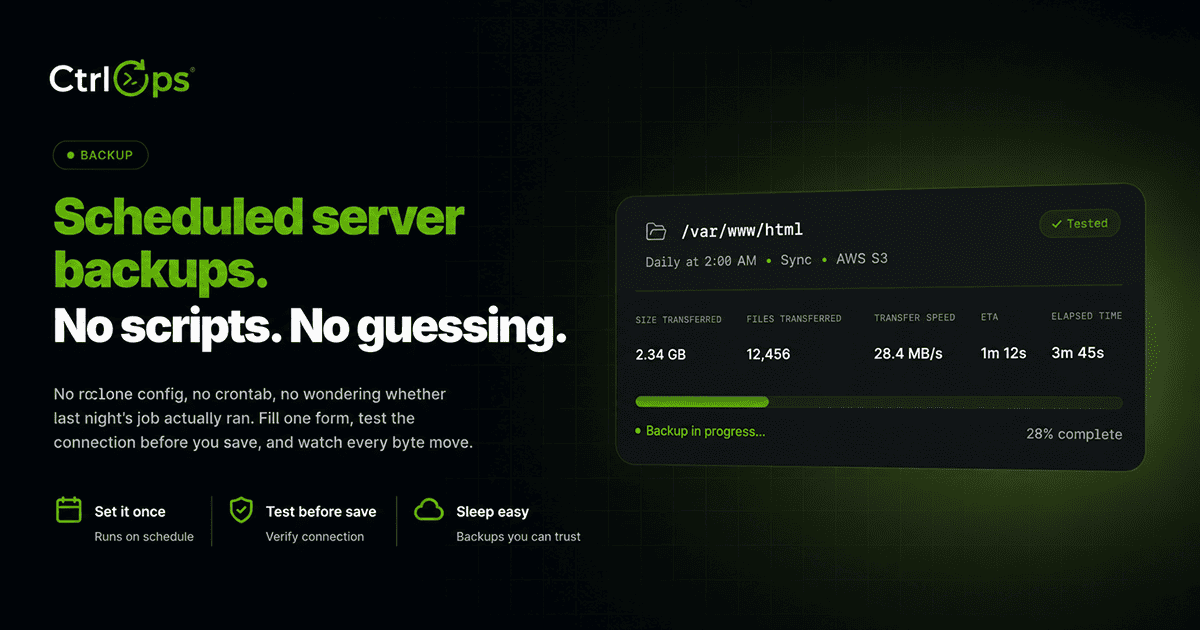
Backup
Scheduled copies of any folder to S3, without writing rclone configs or cron. Watch every run live.
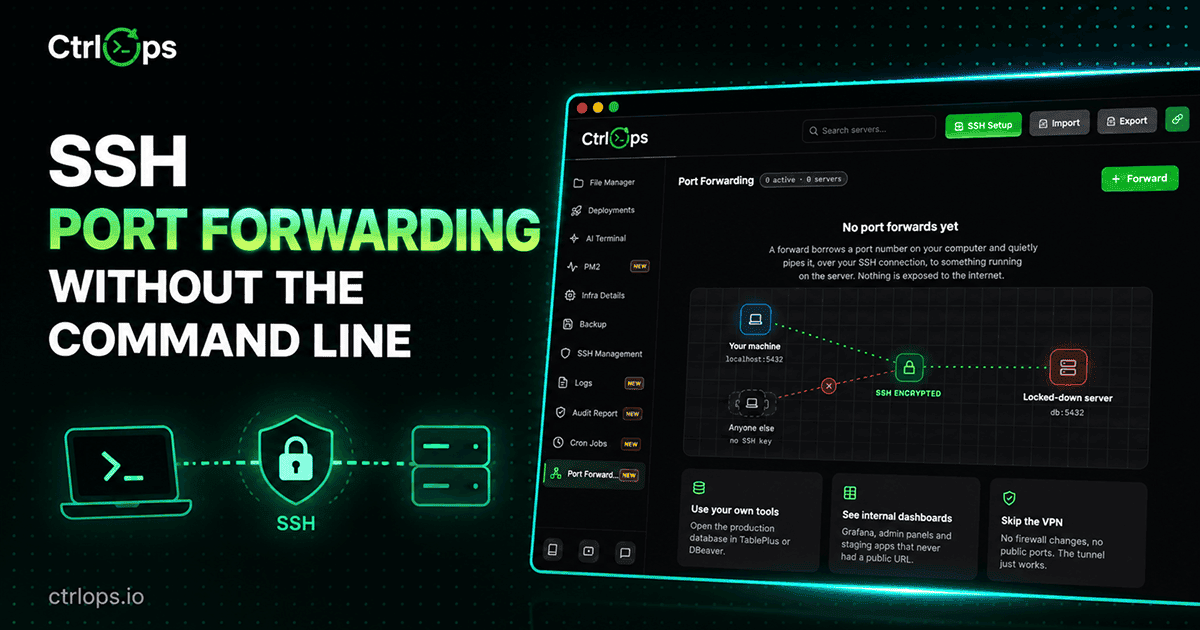
Port Forwarding
Reach a private database or an internal dashboard on your own machine, without opening a port or running a VPN.
Questions before the next restart.
Stop typing pm2 restart.
Connect a server and every PM2 process on it is listed in seconds, with live CPU, memory and logs. Restart, reload or scale any of them in one click. 1-month free trial, no credit card.
✓ Start instantly·✓ No credit card·✓ No sneaky autorenewals