
Key Takeaways
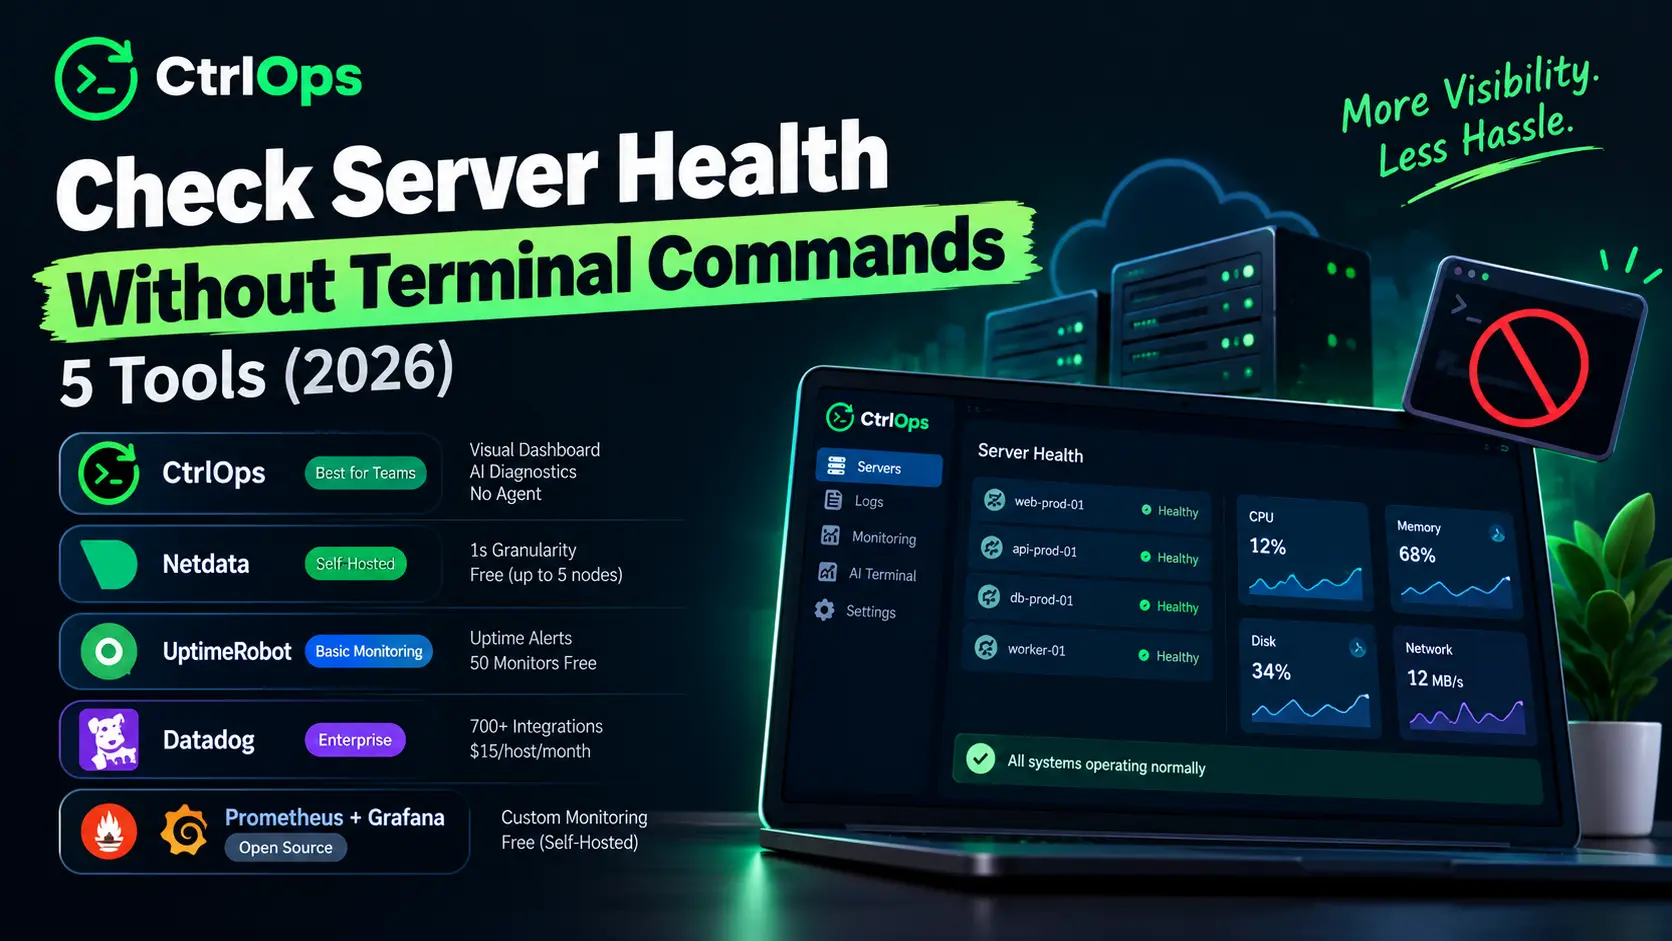
Visual dashboards cut a server health check from 6+ terminal commands to one click. You check server health without terminal commands by connecting a visual tool, over SSH or through a lightweight agent, that shows CPU, memory, disk and processes as gauges and tables. Pick the right server health check tool for your setup:
- Best for small teams running several servers: CtrlOps (visual dashboard, AI diagnostics, no agent, $7/user/month after a 1 month free trial - no credit card required)
- Best free self-hosted: Netdata (1-second granularity, free up to 5 nodes)
- Best for enterprise observability: Datadog (700+ integrations, $15/host/month)
| Tool | Best For | Agent Required | Free Tier | Paid Price |
|---|---|---|---|---|
| CtrlOps | Small teams running several VPS servers | No (SSH only) | 1 month free trial | $7/user/mo (1 mo free) |
| Netdata | Self-hosted real-time dashboards | Yes (lightweight) | Up to 5 nodes | $4.50/node/month |
| UptimeRobot | Basic uptime monitoring | No | 50 monitors | $9/month |
| Datadog | Full-stack cloud observability | Yes | 14-day trial | $15/host/month |
| Prometheus + Grafana | Custom open-source monitoring | Yes (node_exporter) | Fully free | Free (self-hosted) |
What Is a Server Health Check (And Why Does It Matter)?
A server health check is the process of verifying that CPU, memory, disk, and network on your server are operating within safe thresholds. It catches problems like disk filling to 95%, memory leaks consuming all available RAM, or a runaway process spiking CPU to 100%, before these issues crash your application or slow it to a crawl.
Most developers run health checks reactively. Something breaks, a customer complains, and then you SSH in to investigate.
The problem is not that health checks are hard. The problem is that the traditional method requires memorizing terminal commands and interpreting raw output. That friction means most small teams skip regular checks entirely.
Atlassian's State of Developer Experience 2025 report, surveying 3,500 developers and managers across six countries, found that context switching between tools is one of the top three drags on developer productivity. A server health check that requires opening a terminal, remembering commands, and parsing text output is exactly that kind of context switch.
htop, free -h, and df -h in a single dashboard, readable in under 10 seconds.How Do You Check Server Health Without Terminal Commands?
You check server health without terminal commands by using a visual dashboard tool that connects to your server via SSH or a lightweight agent and displays CPU, memory, disk, and process metrics in a graphical interface. No command memorization required.
There are three approaches to building a server health check tool into your workflow:
1. GUI dashboards over SSH (no agent): Tools like CtrlOps connect using your existing SSH credentials and pull metrics directly. Nothing gets installed on your server. You see gauges and tables instead of text output.
2. Lightweight agent dashboards: Tools like Netdata install a small agent on your server. The agent collects metrics at 1-second granularity and serves them through a web dashboard.
3. Cloud-hosted monitoring: Tools like Datadog install an agent that sends metrics to their cloud platform. You view dashboards in your browser with alerting, historical data, and integrations.
Each approach replaces the same set of terminal commands. Here is what that looks like:
| Health Check Task | Terminal Command | Visual Tool Equivalent |
|---|---|---|
| Check CPU usage | top or htop | CPU gauge with live percentage and color coding |
| Check memory | free -h | Memory gauge showing used/total in GB |
| Check disk space | df -h | Storage gauge with percentage and available space |
| Find resource-heavy processes | ps aux --sort=-%cpu | Sortable process table (PID, name, CPU%, Memory%) |
| Clear system cache | sync; echo 3 > /proc/sys/vm/drop_caches | One-click "Clear Buffer/Cache" button |
| Check overall health | Run all 5 commands and interpret each | Glance at 3 color-coded gauges (10 seconds) |
The manual method takes 8-12 minutes per server. Multiply that by 5 servers and you spend an hour just checking, not fixing.
5 Server Health Check Tools That Replace Terminal Commands
These 5 server health check tool options let you monitor server health without typing terminal commands. Each one targets a different team size, budget, and infrastructure setup. We tested all 5 against the same Ubuntu 24.04 servers on DigitalOcean.
1. CtrlOps: Best Server Health Check Tool for Small Teams
CtrlOps is a local-first desktop app that replaces your SSH client, SFTP tool, and monitoring dashboard with a single interface. It connects to any Linux server over SSH and displays live CPU, memory, and disk metrics in a visual dashboard, with zero agent installation.
How the health check works:
Open the app. Click your server name. Click the Infrastructure Details tab. Three circular gauges show CPU, memory, and storage usage with color-coded thresholds: green up to 60%, yellow at 60-80%, orange at 80-90%, red above 90%.
Below the gauges, a Top Processes table lists the 10 heaviest processes with PID, name, CPU%, and memory%. Metrics refresh every 2 seconds automatically.
If memory looks high, click the Clear Buffer/Cache button in the same tab. One click. No sync; echo 3 > /proc/sys/vm/drop_caches to remember. The full walkthrough is in the Infrastructure Details docs.
If something looks wrong and you do not know why, type "Why is my server slow?" into the AI Terminal panel. CtrlOps runs diagnostic commands, shows each one for your approval before executing, and returns a plain-English summary, for example: "Memory at 8%, CPU idle, but disk at 91%. Recommend clearing old logs."
What CtrlOps does beyond health checks:
- One-click deployment for Node.js, React, and Next.js apps (4-5 minutes instead of 30-45 with manual terminal steps)
- GUI file manager with drag-and-drop uploads
- Automated backups to AWS S3, Cloudflare R2, Backblaze B2, DigitalOcean Spaces, Wasabi, MinIO
- Security Audit with 25 audits (157 hardening checks) and downloadable PDF reports
- PM2 visual management for Node.js process monitoring
- Local-only credential storage with AES-256 encryption
Where CtrlOps falls short:
- No mobile app (desktop only: macOS, Windows, Linux)
- No serverless support (Lambda, Cloud Functions)
- No Kubernetes or container orchestration
- No push alerts yet (live dashboard only, alerts are on the roadmap)
Pricing: $7/user/month (unlimited servers) after a 1 month free trial - no credit card required. $70/user/year. See pricing.
Platforms: macOS (Apple Silicon + Intel), Windows, Linux.
2. Netdata: Best Free Open-Source Server Health Check Tool
Netdata is an open-source monitoring agent that collects per-second metrics from your server and displays them in a pre-built web dashboard. The agent installs with a single command and starts showing metrics immediately.
How the health check works:
Run the install script on your server (one curl command). Open your browser to the Netdata dashboard URL. You see real-time charts for CPU, memory, disk I/O, network, and hundreds of other metrics, updating every second.
Netdata's dashboards are pre-configured. You do not need to build queries or create panels. The agent auto-detects running services (Nginx, MySQL, Docker, Redis) and adds relevant charts automatically.
What Netdata does well:
- 1-second metric granularity (most tools poll every 15-60 seconds)
- Auto-discovers running services and adds monitoring charts
- Pre-configured alerts with sensible defaults
- Metrics are stored on your own nodes rather than shipped to a vendor database
- Lightweight agent with minimal CPU overhead
Where Netdata falls short:
- Requires agent installation on every server
- Free tier limited to 5 nodes
- No deployment automation, file management, or AI diagnostics
- Dashboard can be overwhelming with hundreds of charts
Pricing: Free (Community plan, up to 5 nodes). Business: $4.50/node/month (billed annually). Enterprise: custom pricing.
Platforms: Linux, macOS, FreeBSD, Docker.
3. UptimeRobot: Best for Simple Uptime Checks
UptimeRobot is not a full server health check tool. It monitors whether your server is reachable and responding. That is a different question from "Is my CPU at 90%?", but it is the first question most developers need answered.
How it works:
Add your server IP or domain. UptimeRobot pings it every 5 minutes (free plan) or every 60 seconds (paid). If it goes down, you get an email or Slack alert.
What UptimeRobot does well:
- 50 monitors free (HTTP, ping, port, keyword)
- No agent installation
- Alerts via email, Slack, SMS, webhooks
- Public status pages for client-facing uptime reporting
Where UptimeRobot falls short:
- No CPU, memory, or disk monitoring
- No server-level diagnostics
- Cannot tell you WHY a server went down
- 5-minute check intervals on the free plan
Pricing: Free (50 monitors, 5-min intervals). Solo: $9/month billed annually (50 monitors, 60-second intervals). Team: $35/month billed annually (100 monitors, 30-second intervals). Enterprise: custom.
Platforms: Web-based (no installation).
UptimeRobot answers "Is my server up?" but not "Is my server healthy?" Pair it with CtrlOps or Netdata for a complete picture.
4. Datadog: Best Server Health Check Tool for Enterprise Teams
Datadog is a cloud-hosted observability platform with 700+ integrations. It monitors infrastructure, application performance, logs, and security from a single dashboard.
How the health check works:
Install the Datadog Agent on your server. Metrics start flowing to your Datadog dashboard within minutes. Pre-built dashboards show CPU, memory, disk, network, and process-level metrics. Set alerts on any threshold.
What Datadog does well:
- 700+ integrations (AWS, GCP, Azure, Kubernetes, Docker, databases)
- Customizable dashboards with drag-and-drop widgets
- Alerting with PagerDuty, Slack, email, SMS integrations
- Historical data for capacity planning and trend analysis
- APM (Application Performance Monitoring) for code-level insights
Where Datadog falls short:
- Agent required on every host
- Pricing scales fast: a 10-host team pays $150/month before adding APM, logs, or custom metrics
- Complex pricing model with per-host, per-GB, and per-metric charges
- Overkill for teams managing 3-10 servers
Pricing: Infrastructure Monitoring: $15/host/month (Pro, billed annually). Enterprise: $23/host/month. APM adds $31/host/month. Log Management: $0.10/GB ingested, plus a per-million-events charge for indexed logs.
Platforms: Linux, Windows, macOS, Docker, Kubernetes, cloud platforms.
5. Prometheus + Grafana: Best Open-Source Server Health Check Stack
Prometheus collects metrics. Grafana displays them. Together, they form the most popular open-source monitoring stack in the world.
How the health check works:
Install node_exporter on each server you want to monitor. Configure prometheus.yml to scrape metrics from those servers. Set up Grafana, add Prometheus as a data source, and import a pre-built dashboard (Dashboard ID 1860 for Node Exporter Full).
What Prometheus + Grafana does well:
- Completely free and open-source
- PromQL query language for complex metric analysis
- Grafana dashboards are highly customizable
- Massive community with thousands of exporters and dashboards
- Scales to thousands of servers
Where Prometheus + Grafana falls short:
- Setup takes 2-4 hours minimum for a first-time user
- Requires a dedicated server to run Prometheus
- No built-in alerting UI (needs Alertmanager configuration)
- No deployment, file management, or AI features
- Ongoing maintenance: storage management, retention policies, upgrades
Pricing: Free (open-source). Grafana Cloud has a free tier with 10,000 metric series.
Platforms: Linux, Docker, Kubernetes.
How to Check Server Health in Under 5 Minutes
Here is the step-by-step process using CtrlOps as the server health check tool example. The same logic applies to any visual dashboard.
Step 1: Connect to your server (30 seconds). Open CtrlOps. Click your server name. The app connects over SSH using your saved credentials.
Step 2: Open the health dashboard (2 seconds). Click the Infrastructure Details tab. Three gauges appear: CPU, Memory, Storage.
Step 3: Read the gauges (10 seconds). Green means healthy. Yellow means watch it. Orange means act soon. Red means act now. If all three are green, your server is healthy. Move to the next server.
Step 4: Check the process table (30 seconds). Scroll down to the Top Processes table. Look for any process consuming more than 50% CPU or memory. Click the column header to sort.
Step 5: Investigate anomalies with AI (2-3 minutes, only if needed). If something looks wrong, type a question into the AI Terminal: "Why is CPU at 87%?" or "What is using all the disk space?" The AI runs diagnostic commands, waits for your approval on each one, and returns a specific answer.
Total time: 30 seconds for a healthy server. Under 5 minutes if something needs investigation.
Compare that to the terminal method:
| Method | Time per Server | Time for 5 Servers | Commands to Remember |
|---|---|---|---|
| Terminal commands (manual) | 8-12 minutes | 40-60 minutes | 6+ commands |
| Visual dashboard (CtrlOps) | 30 seconds | 2.5 minutes | Zero |
When Should You NOT Use a Visual Dashboard?
A visual server health check tool works well for 80% of small-team monitoring needs. But they are not the right choice for every situation.
Use terminal commands or specialized tools instead when:
- You manage Kubernetes clusters or container orchestration. Visual dashboards built for VMs do not show pod-level metrics, container restarts, or namespace resource limits. Use Datadog, Prometheus + Grafana, or Lens.
- You need custom application metrics. Server health covers CPU, RAM, and disk. If you need request latency per endpoint, database query times, or cache hit ratios, you need APM tools like Datadog APM or New Relic.
- You need compliance-grade audit trails. If your industry requires SOC 2 or HIPAA-compliant monitoring with tamper-proof logs, enterprise tools like Datadog or Splunk provide that. CtrlOps and Netdata do not.
- You run serverless architectures. AWS Lambda and Google Cloud Functions have no server to monitor. Use the cloud provider's built-in monitoring.
Conclusion
You do not need to memorize htop, free -h, or df -h to check server health. A visual server health check tool shows the same metrics in a format anyone on your team can read in seconds.
For developers and DevOps teams running multiple servers, CtrlOps combines health monitoring with SSH, file management, deployment, and AI diagnostics in one local-first desktop app, at $7/user/month after a 1 month free trial - no credit card required. For a free self-hosted option, Netdata delivers 1-second metrics with pre-built dashboards. For enterprise teams, Datadog provides full-stack observability at enterprise pricing.
Pick the server health check tool that matches your team size and budget. You can always add more monitoring later. What you cannot afford is finding out your disk is full because your app just crashed.
Frequently Asked Questions
Use a visual server health check tool with a graphical dashboard, like CtrlOps, Netdata, or Datadog. These tools display CPU, memory, and disk usage in graphical dashboards instead of raw text output. CtrlOps connects via SSH with no agent required. Netdata installs a lightweight agent. Datadog uses a cloud-hosted agent. All three eliminate the need to run commands like htop, free -h, or df -h manually.
The top 5 server health check tools for small teams in 2026 are CtrlOps ($7/user/month after a 1 month free trial, visual dashboard with AI), Netdata (free up to 5 nodes, 1-second metrics), UptimeRobot (free uptime checks), Datadog ($15/host/month, enterprise-grade), and Prometheus + Grafana (free, open-source, requires setup). CtrlOps and Netdata are the best starting points for teams under 10 people.
Yes. CtrlOps monitors server health over your existing SSH connection without installing any agent or script on the server. It pulls CPU, memory, disk, and process metrics directly through SSH. UptimeRobot also requires no agent but only checks uptime, not resource usage. Most other tools (Datadog, Netdata, Prometheus) require an agent installed on the monitored server.
For most small teams, yes. Setting up Prometheus requires installing node_exporter on each server, configuring YAML scrape targets, running a Prometheus server, setting up Grafana, and importing dashboards. The initial setup takes 2-4 hours. Ongoing maintenance includes storage management and upgrades. For 3-5 servers, CtrlOps (no setup) or Netdata (one install command) provides the same core health metrics with significantly less overhead.
Check five core metrics: CPU usage (sustained above 80% needs investigation), memory usage (watch for steady increases without drops, which suggest a memory leak), disk space (above 85% is a warning, above 95% risks crashes), running processes (unexpected spikes indicate runaway services), and load average (values consistently above your CPU core count mean the server is overloaded).
For production servers, check health daily at minimum. Visual dashboard tools like CtrlOps make this practical because a glance takes 10 seconds per server. For critical production systems, use a tool with continuous monitoring and alerting (Datadog, Netdata, or Prometheus) so you receive notifications when metrics cross thresholds instead of relying on manual checks.
Yes. CtrlOps connects to any Linux server accessible via SSH, regardless of hosting provider. This includes AWS EC2, DigitalOcean Droplets, Hetzner Cloud, Linode, Vultr, and any bare-metal or VPS provider. It communicates directly over standard SSH with no vendor-specific agent or API integration required.
Netdata is the cheapest full-featured option at $0 for up to 5 servers. For teams needing more than monitoring (deployment, file management, AI diagnostics), CtrlOps costs $7/user/month after a 1 month free trial - no credit card required. Prometheus + Grafana is completely free but requires significant setup and maintenance time, which has its own cost in developer hours.
Yes. CtrlOps includes an approval-gated AI Terminal that accepts natural language questions like "Why is my server slow?" or "What is using all the disk space?" The AI runs diagnostic commands, shows each one for your approval before execution, and returns a specific answer with context from your server's actual state. You can bring your own API key from OpenAI, Anthropic Claude, or Google Gemini.
CtrlOps is built for developers and small DevOps teams managing 3-15 servers. It costs $7/user/month after a 1 month free trial, with unlimited servers, and includes deployment, file management, and AI diagnostics alongside monitoring. Datadog is built for engineering teams that need full-stack observability across hundreds of hosts with APM, log aggregation, and 700+ integrations. It starts at $15/host/month and scales quickly. If you do not need APM or log management, CtrlOps delivers the health monitoring you need at a lower cost.
Skip visual dashboards when you manage Kubernetes clusters (use Lens or Datadog), need custom application-level metrics like request latency per endpoint (use Datadog APM or New Relic), require compliance-grade audit trails for SOC 2 or HIPAA (use enterprise monitoring platforms), or run serverless architectures where there is no server to monitor. For standard VPS and VM monitoring, visual dashboards cover everything.